Rule of 40 or Rule of X?


TL;DR: On average, private software companies at $100M+ trail public cloud under the Rule of 40 and lead it under the Rule of X. That lead is an average. It comes from a long tail of hypergrowth companies that public markets rarely hold, while the median private company still trails on both. Asked to pick the same number of companies, the two frameworks agree on 9 in 10. The ones they split on show what each rule rewards. In this cycle, that trade leans AI. And because each framework favors a different profile, the better choice depends on what you’re underwriting.
Rule of 40 was built for companies that balance growth and margin
The Rule of 40 holds that a software company’s revenue growth rate and profit margin should add up to at least 40%. Brad Feld popularized it in 2015 after hearing it from a late-stage investor, and he meant it for companies with at least $50M in revenue, big enough to have settled how much growth to trade for profit.
Most public software companies fit that description, while their private peers are still paying for growth. That raises a question: Is the Rule of 40 the right way to measure them?
When we published our Rule of 40 report, which examined 1,377 venture-backed private companies, Byron Deeter of Bessemer replied that he stands by the Rule of X as the better metric for building a growth business. Growth, he argued, is more valuable than free cash flow early on.

The Rule of X, introduced by Bessemer in 2024, counts growth twice before adding margin. Bessemer’s argument is that a point of margin adds value linearly while a point of growth compounds.
As a follow-up to our report, we tested that claim on private venture-backed companies with $100M+ in annualized revenue that report to their investors on Standard Metrics, drawn from the portfolios of 150+ VC/PE firms. Using the Rule of X with a multiplier of 2, we compared how public and private companies perform under both frameworks, examined which companies each one favors when both are equally selective, and looked at how AI companies fare under a rule that weights growth over margin.
Rule of X is the framework built for companies still buying growth
Under the Rule of 40, private companies underperformed public ones. In 2023, the average private company in our dataset with $100M+ in annualized revenue scored 23. The BVP Cloud Index, tracking emerging public companies in the cloud software industry, averaged about 31, per Bessemer’s published figures. Today those numbers are 36 and 41, respectively.
The picture changes under the Rule of X, which gives fast-growing companies more credit. In 2023, the same cohort of companies averaged a score of 57 under the Rule of X. The BVP Cloud Index averaged about 50. Today those numbers are 78 and 60, respectively.
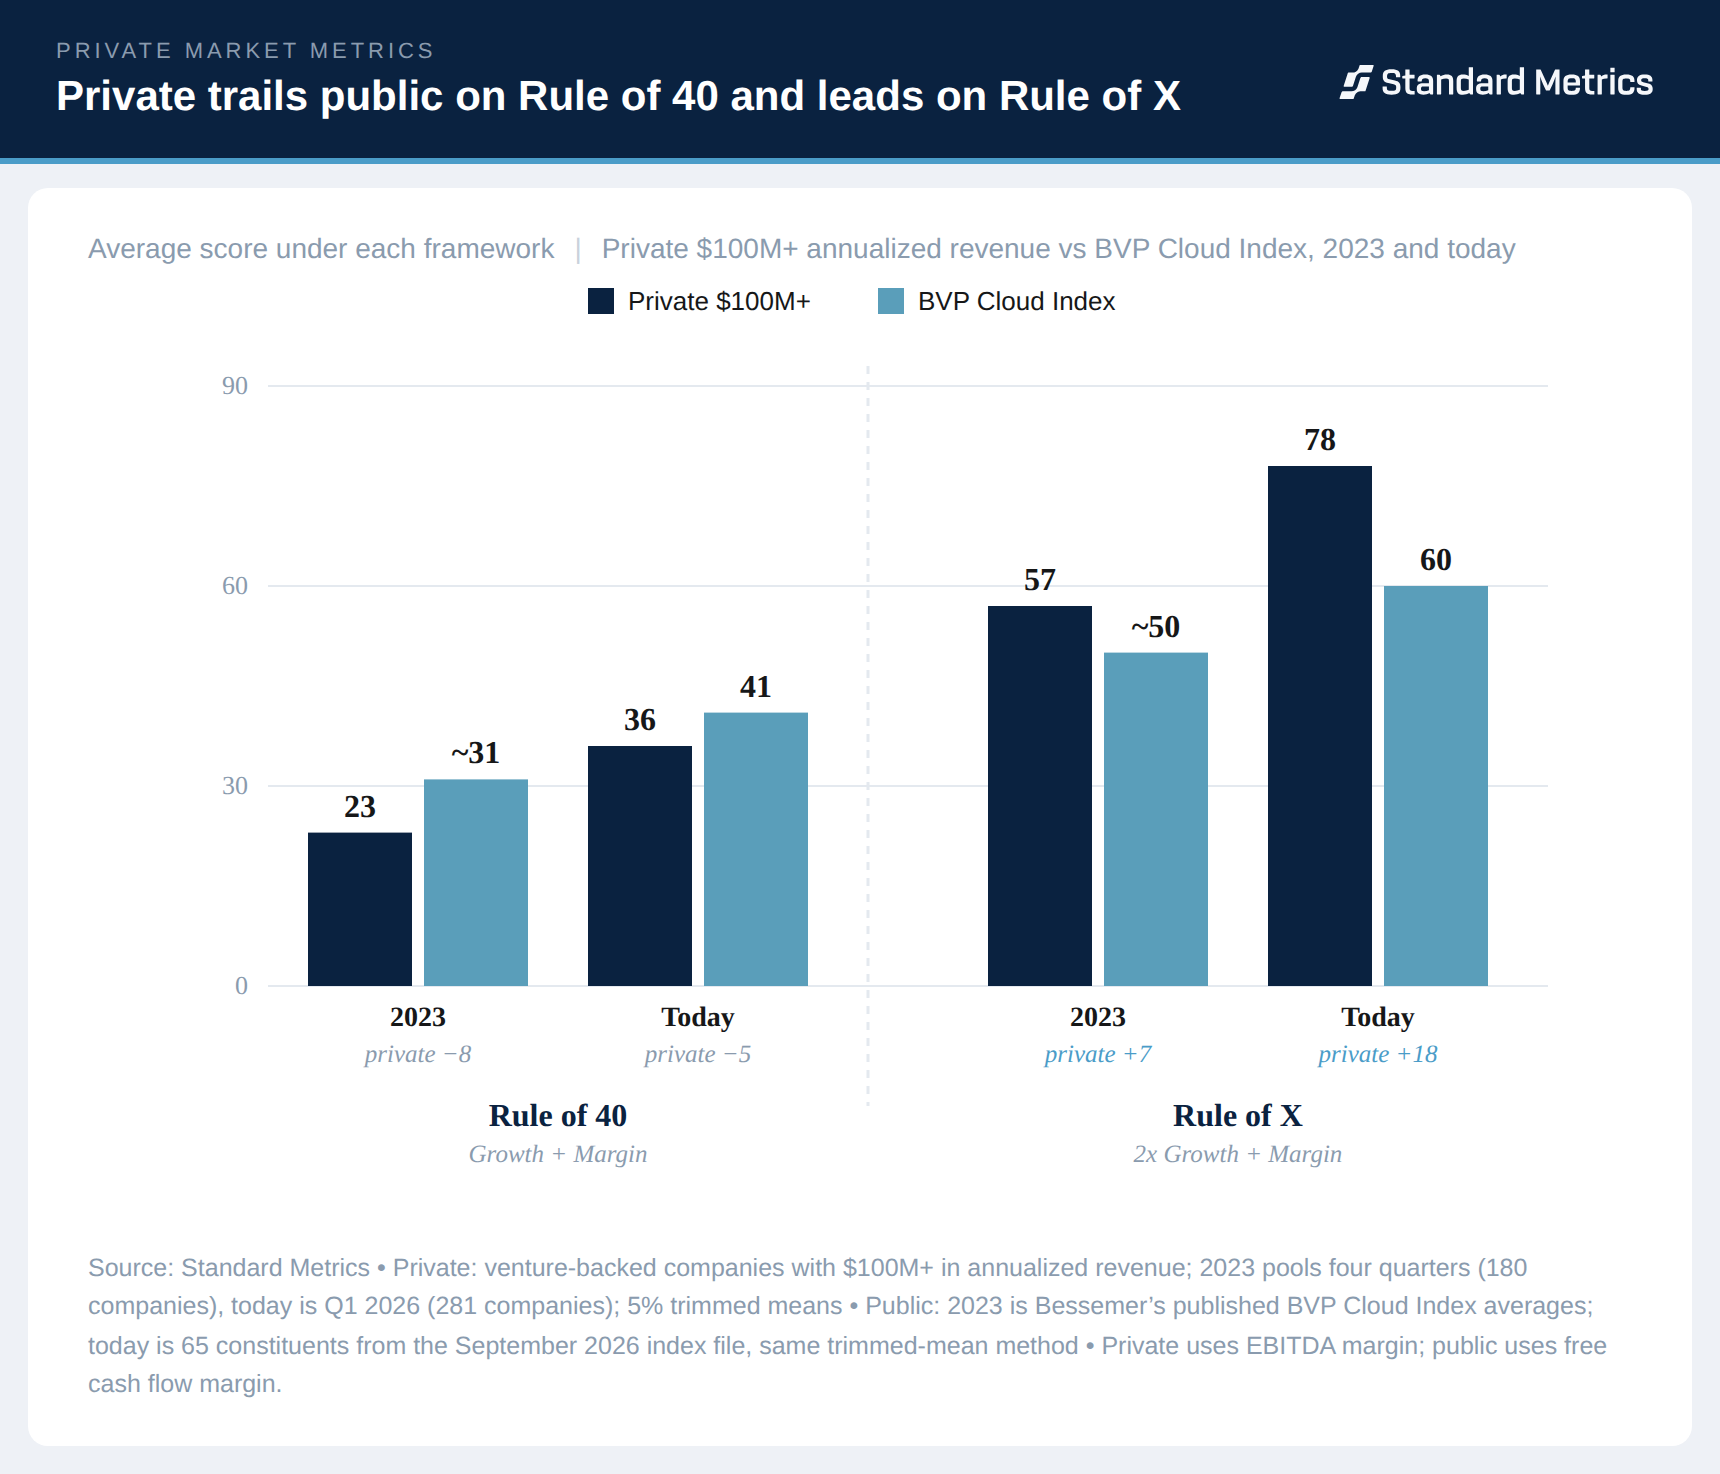
Two things drive that lead: stage and distribution.
Today, private companies grow revenue 41% a year, against 20% for public cloud, which is a stage difference and true of the typical company. And the average is pulled up by a tail of very fast growers that is rare in public indices, which is a distribution difference.
But private companies lose 3 cents on every dollar of revenue, while public companies generate 21. The Rule of 40 weighs growth and margin equally, and the margin gap wins. The Rule of X counts growth twice, and the growth gap wins. (One note on the margin comparison between our private market dataset and Bessemer’s public market dataset: EBITDA margin is what companies report to their investors, so we use it as a proxy for Bessemer’s free cash flow margin.)
This analysis doesn’t use valuation data, so it can’t test whether the Rule of X predicts what private companies are worth. On the public side, ICONIQ has: As of Q2 2026, the Rule of X explains more of the variation in software revenue multiples than the Rule of 40, revenue growth, or free cash flow margin alone. ICONIQ puts the market-implied multiplier at about 2.7x; we use Bessemer’s more conservative 2x. What we can add is the private side: The Rule of X is the framework built for the stage these companies are at, and Deeter’s claim holds when tested on them.
Under Rule of X, hypergrowth companies pull the private average ahead
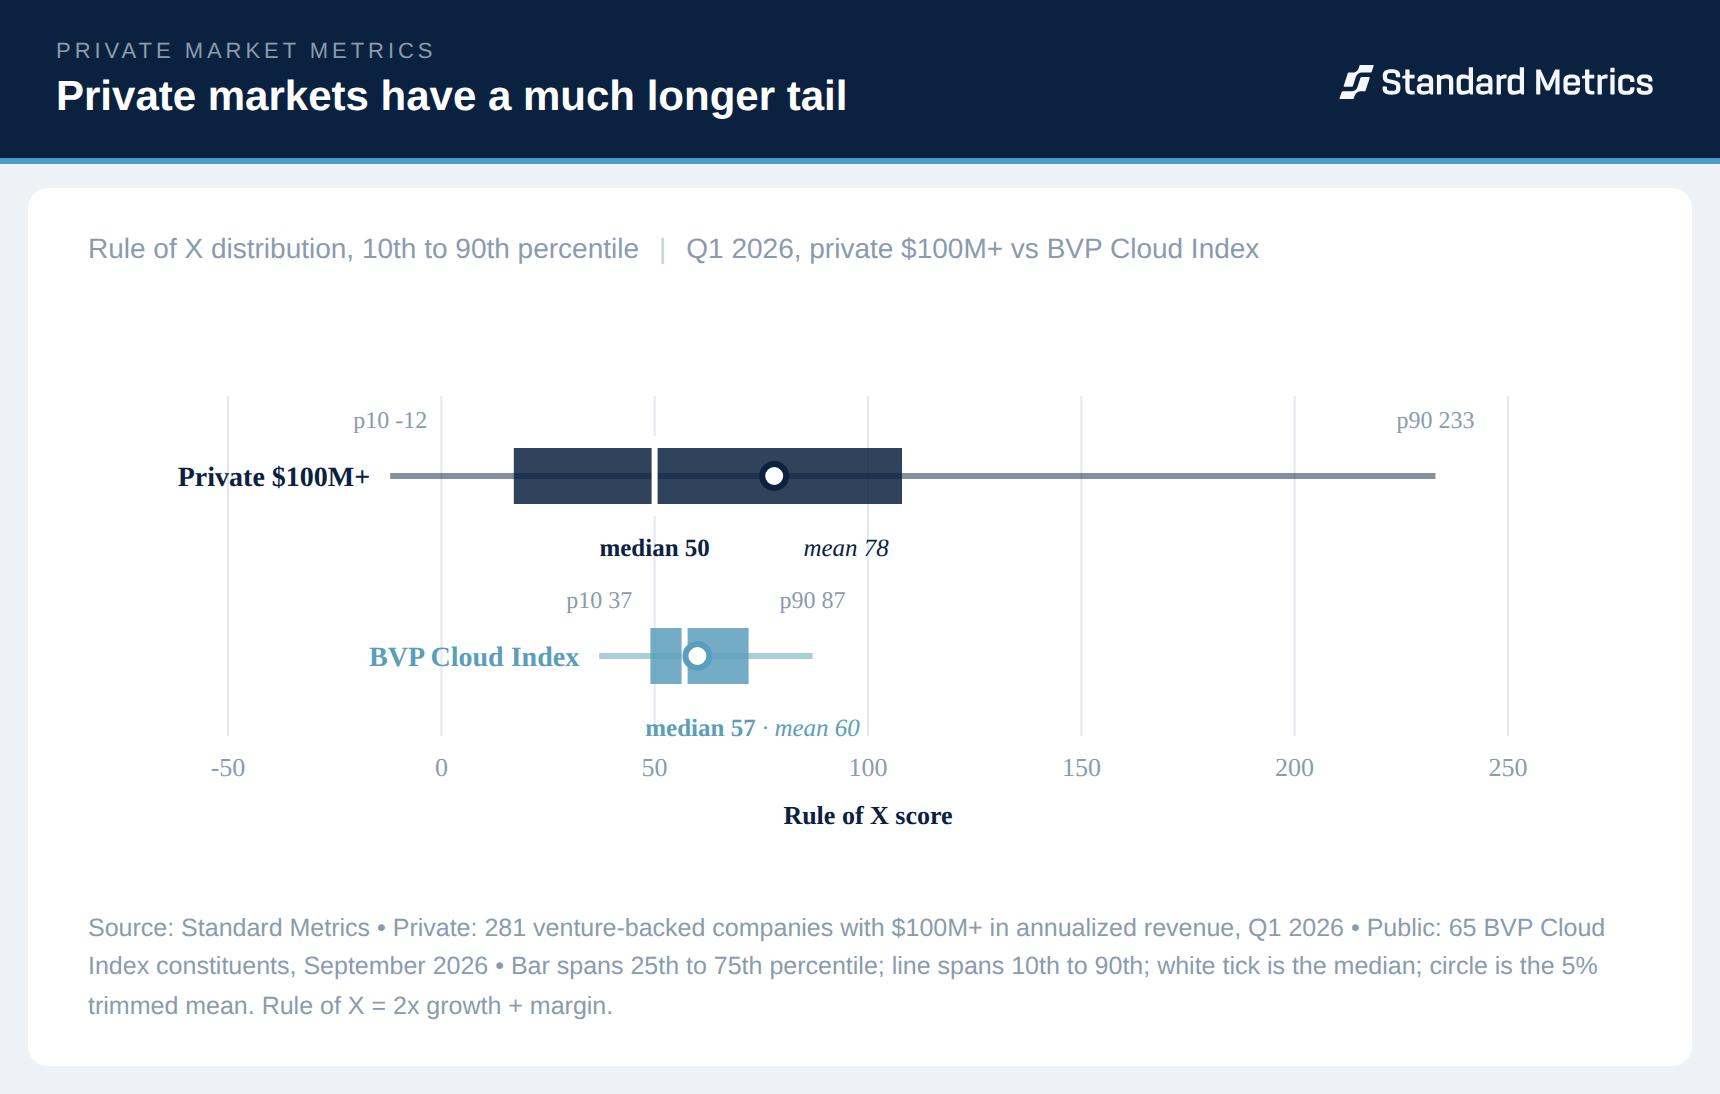
The advantage in the averages comes from the upper end of the distribution, the fastest growers. The median private company, however, trails public cloud on both frameworks.
The size of that tail is the difference between the two markets. Today, on the Rule of X, the private average sits 28 points above its median. For the public index, the two are 3 points apart. The chart above shows the rest of the spread.
Of the 65 constituents in the BVP Cloud Index, only one grows faster than 50%, and that’s Palantir at 93%. Only one has negative free cash flow. By contrast, of the 281 private companies at $100M+, 28% grow at or above 50%, and 52% burn cash on an EBITDA basis.
This is why framework choice matters more in private markets than in public ones. Switching frameworks barely moves a tightly clustered public index, but it reorders a private cohort spread this wide, because the Rule of X doubles the weight on the variable where that spread lives.
The trade between frameworks
The Rule of X will always pass more companies than the Rule of 40 at the same threshold. Double the growth term, keep the bar at 40, and every company with positive growth scores higher. That is arithmetic, and it tells you nothing about the companies.
So we changed the question. Instead of asking how many companies pass each rule, we asked: If both rules could only pick the same number of companies, would they pick the same ones?
In Q1 2026, the Rule of 40 passed 101 of the 281 private companies we examined. We raised the Rule of X bar until it also passed exactly 101, which happens at a score of 76. The two lists overlapped on 88 companies. The other 13 made one list but not the other.
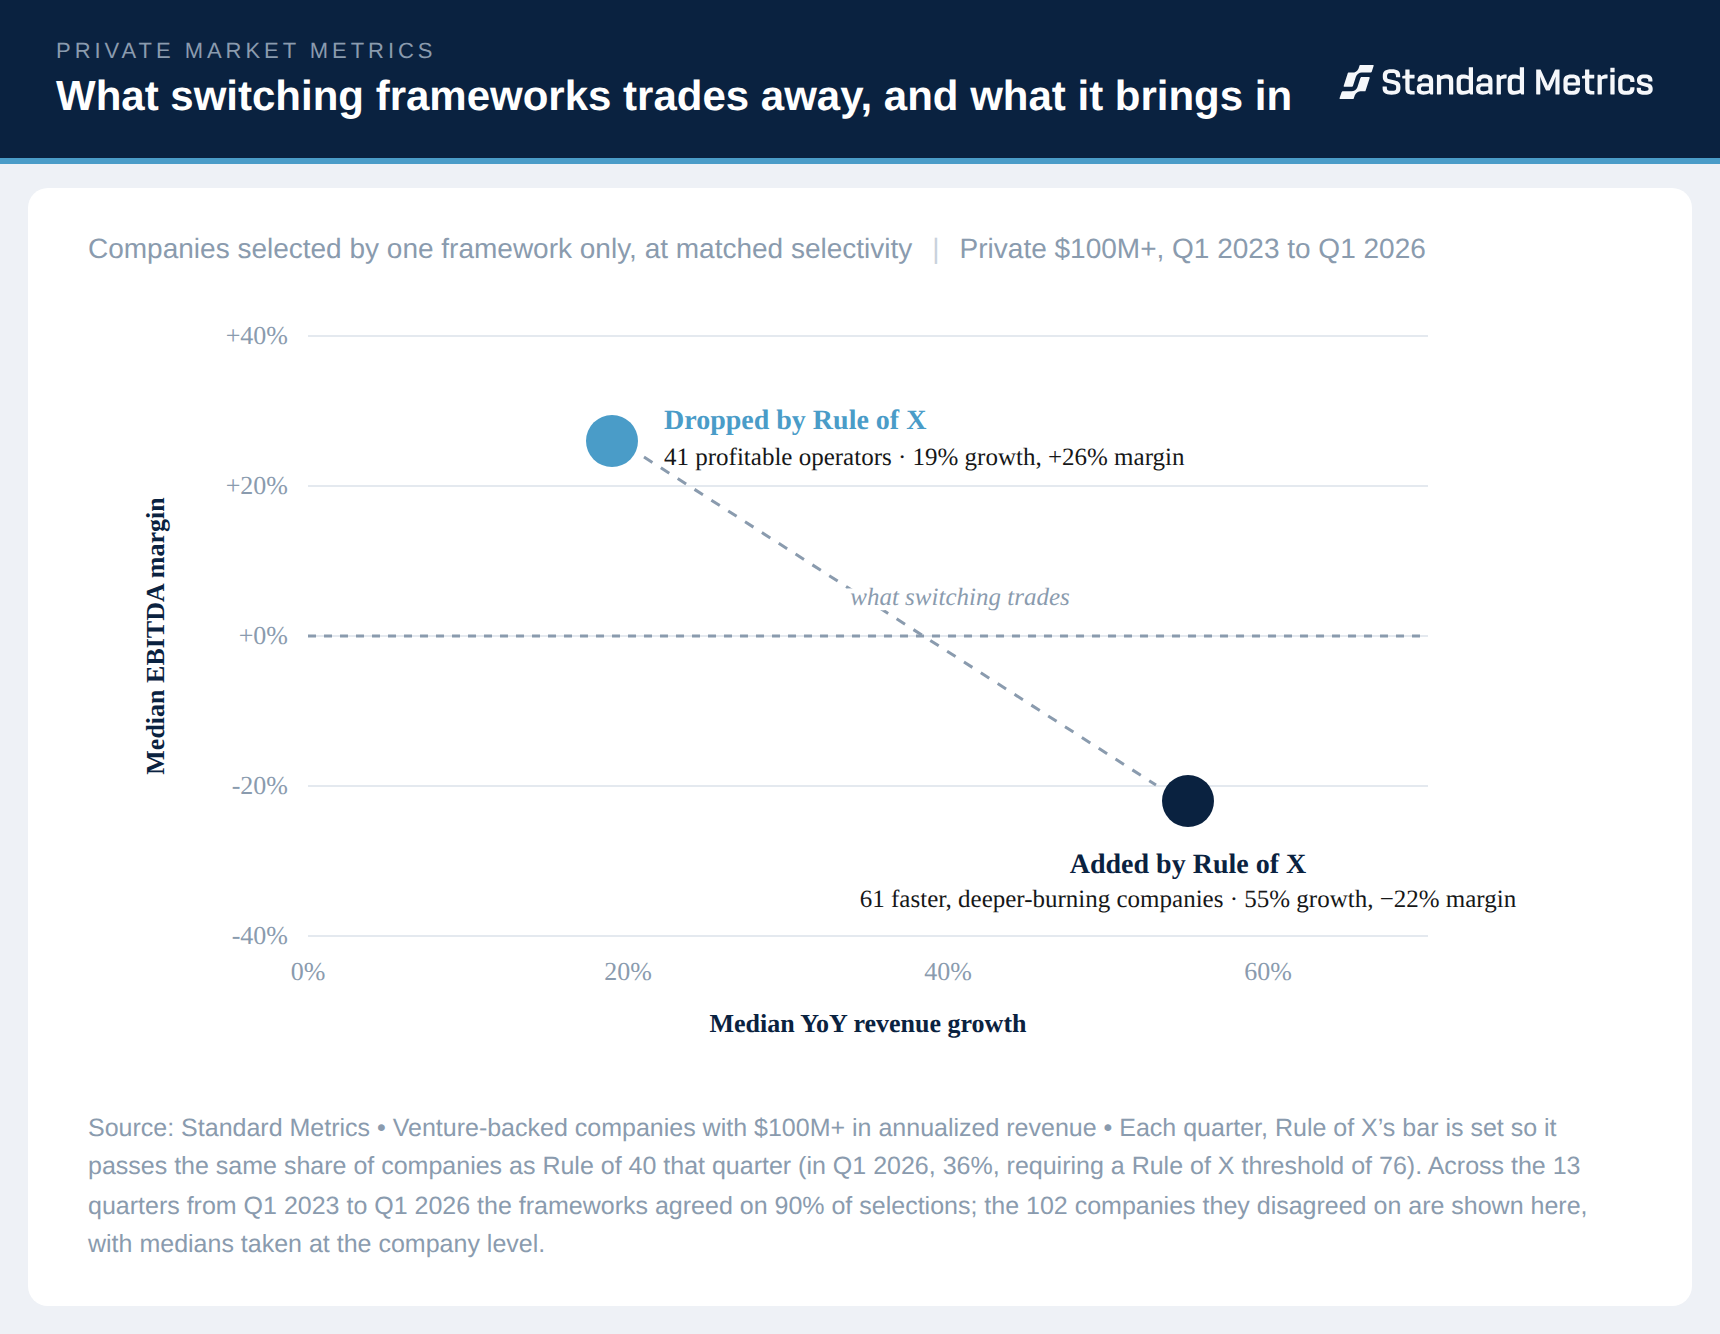
We pooled the results from Q1 2023 through Q1 2026, matching the pass rate quarter by quarter. Across those 13 quarters, the two frameworks agreed on 90% of their selections. We looked at the profile of the 102 companies they disagreed on: The Rule of X swapped out 41 profitable operators, with median growth of 19% and margins of 26%, for 61 companies growing faster and burning more, with median growth of 55% and margins of −22%.
No surprises there: When growth is rewarded, high-growth companies get selected over high-margin ones. But the two groups behave differently over time. The 41 companies the Rule of 40 selects are stable, profitable operators that keep showing up quarter after quarter. One of them appeared in 11 of the 13 quarters. The 61 that the Rule of X adds mostly appear once.
In this cycle, that trade leans AI
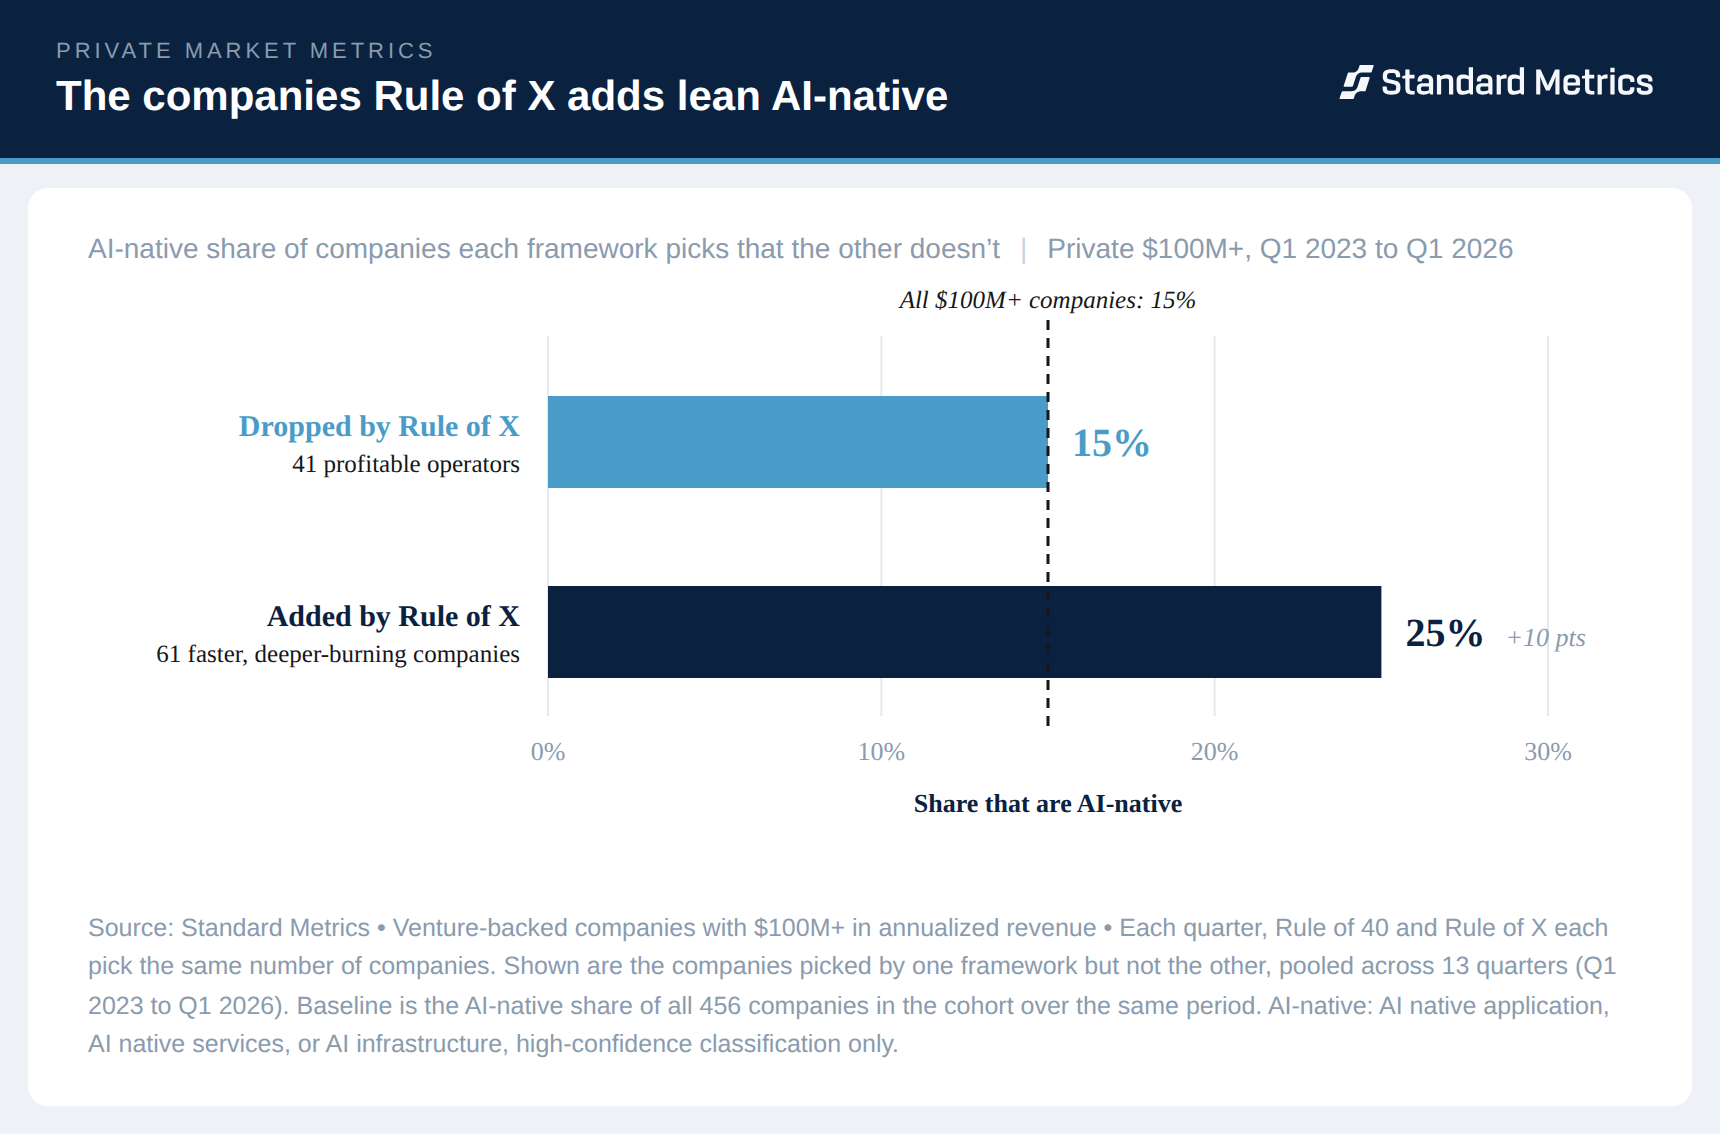
Of the 61 companies the Rule of X added, 25% are AI-native. Of the 41 it dropped, 15% are, which matches the AI share of the $100M+ cohort as a whole.
This is consistent with our Rule of 40 report, which found AI-native companies growing faster and burning more than non-AI peers in every zone. A framework that doubles the credit for growth will favor that shape.
Bessemer’s own guidance is that the multiplier should move with the market. They put the long-run ratio at 2x to 3x, and encourage tailoring it to current market dynamics, which is why it’s called X. Right now the premium sits with AI. Per Carta, AI companies took 58% of all Series D capital in 2025 and more than 60% of all venture dollars in Q1 2026. A firm that anchors on the Rule of X is already underwriting growth over margin, so in this cycle it will hold more AI-native companies and fewer profitable operators.
Used together, the frameworks answer different questions
In our Rule of 40 report, we split companies into four zones to see how each one clears the bar: through growth, through margin, or neither. The premise behind that split is the same one behind the Rule of X. Growth and margin should not be treated as interchangeable. The zones handle that by separating the two, so you can see the mix. The Rule of X handles it by reweighting, so growth counts twice.
Growth is what compounds. Margin is what a company controls. The Rule of 40 and the Rule of X weight those differently, which is why the choice is less about which is right and more about which matches your strategy, whether you’re evaluating a new investment or your existing portfolio. The Rule of X will systematically favor pre-margin growers. The Rule of 40 will favor profitable operators. The zones sit underneath both and show which of the two any given company actually is. Pick the score that surfaces your strategy, use the other to check your blind spots, and use the zones to read what you’ve picked.
For founders, know which lens your investors use to evaluate you, since the same numbers rank differently under each. And a single quarter above the bar matters less than the direction of travel: our Rule of 40 report found that only 37% of companies clearing on growth were still there a year later.
Standard Metrics runs benchmarking analysis regularly against reported financials from over 10,000 venture-backed private companies. Our next report will be published in October, covering findings through Q2 2026 data. If there is a framework or metric you want us to test against the dataset, reach out at benchmarking@standardmetrics.io.
Methodology
Private cohort: companies in the Standard Metrics dataset with $100M+ in annualized revenue and reported financials. Each section uses the cohort that fits its question: 2023 where Bessemer’s published benchmarks allow a like-for-like public comparison, Q1 2026 for current private figures, and the 13-quarter pool where the analysis needs a larger sample. The 2023 figures pool four quarters (Q1 to Q4 2023, n=180). Current figures use Q1 2026 (n=281). The equal-pass-rate analysis pools 13 quarters (Q1 2023 to Q1 2026, n=456). The Rule of X’s threshold is set each quarter to match that quarter’s Rule of 40 pass rate, so the two frameworks select the same number of companies in every period. The cohort grew from 180 to 281 companies between 2023 and 2026, so figures for each period reflect the cohort as it existed then, not a fixed set of companies.
Statistics: We report 5% trimmed means where we compare against the averages Bessemer publishes. The trim removes extreme values at both ends, mostly companies growing off a very small base, without removing the fast-growth tail that is part of the finding. The dispersion comparison reports both mean and median. The swap profiles are medians, taken at the company level.
Public comparison: 2023 public figures are Bessemer’s published BVP Cloud Index averages (about 31 on the Rule of 40, about 50 on the Rule of X). Current public figures are computed from the BVP Cloud Index constituent file dated September 14, 2026, covering 65 companies, using the same trimmed-mean method. Bessemer’s own Rule of X column in that file uses a 2x growth multiplier, which is also what we use.
Margin metric: Bessemer computes the Rule of X with free cash flow margin. We use EBITDA margin, which is what companies report on our platform. The two can differ in either direction. Feld’s original post did not specify a margin metric, listing EBITDA, operating income, net income, and free cash flow as candidates.
Frameworks: Rule of 40 is YoY revenue growth + EBITDA margin. Rule of X is 2 x YoY revenue growth + EBITDA margin. Zone definitions follow the four-zone framework in our Rule of 40 report, with a 35% growth split.
AI classification: AI-native companies are those classified as AI native application, AI native services, or AI infrastructure, high-confidence records only. AI-enabled SaaS and robotics are excluded. Classification is applied at the company level and held constant across quarters.
Automate your portfolio reporting
Find out how you can:
- Collect a higher volume of accurate data
- Analyze a robust, auditable data set
- Deliver insights that drive fund performance