Hand Claude or ChatGPT a single clean PDF and ask a question about it, and you get a fast, accurate answer. A single model can pull a revenue figure from a board deck, summarize a CEO’s quarterly commentary, or flag what should be included in an LP update, and it can do it well. These are real strengths, and a fund ops analyst who uses a general-purpose model for a first-pass document review is making a sensible choice. But AI starts to break at scale — 50 of these questions for 50 portfolio questions, standardized to a set data schema, usable by all at the firm, with strong security and permissions — and AI falls apart.
We cover the pros and cons of off-the-shelf AI vs. a purpose-built extraction process as well as when a firm should think about upgrading.
Why portfolio document parsing is a structured data extraction problem
Ask a model to summarize a board deck and it returns a fluent paragraph describing the quarter. That output reads well and answers a question about one document. A centralized, reliable portfolio monitoring system needs something different. It needs a portfolio company’s ARR figure as a number in a field labeled “ARR,” its burn rate parsed from the cash flow statement, and a record showing that both came from page 14 of a specific file uploaded on a specific date. Summarization can produce prose about a portfolio company for a human to read. Purpose-built extraction produces structured rows across your portfolio that a database can store, a valuation model can pull from, and an auditor can trace.
That distinction is the reason why an off-the-shelf AI tool likely isn’t the best solution for all your portfolio monitoring needs. An accurate source of truth about your portfolio requires consistent field-level extraction, standardization across hundreds of documents and thousands of data points, and validation by humans-in-the-loop who actually understand portfolio company financials. You need the same fields pulled the same way across documents that many portfolio companies format differently. You want every company’s idiosyncratic labels to come together in one common taxonomy so figures from forty companies roll up into a single comparable set. You want a process that has financial understanding built in so AI-errors are caught by built-in flags (”company runway is negative not positive – is this an error?”) and checked by humans-in-the loop (”a negative sign was inputted incorrectly and revenue was positive in the quarter, thanks for the flag”).
Off-the-shelf LLMs vs. purpose-built extraction pipelines
The two approaches diverge on the dimensions firms have to defend in a follow-on decision, an LP report, or an audit. The table below describes what each one actually produces.
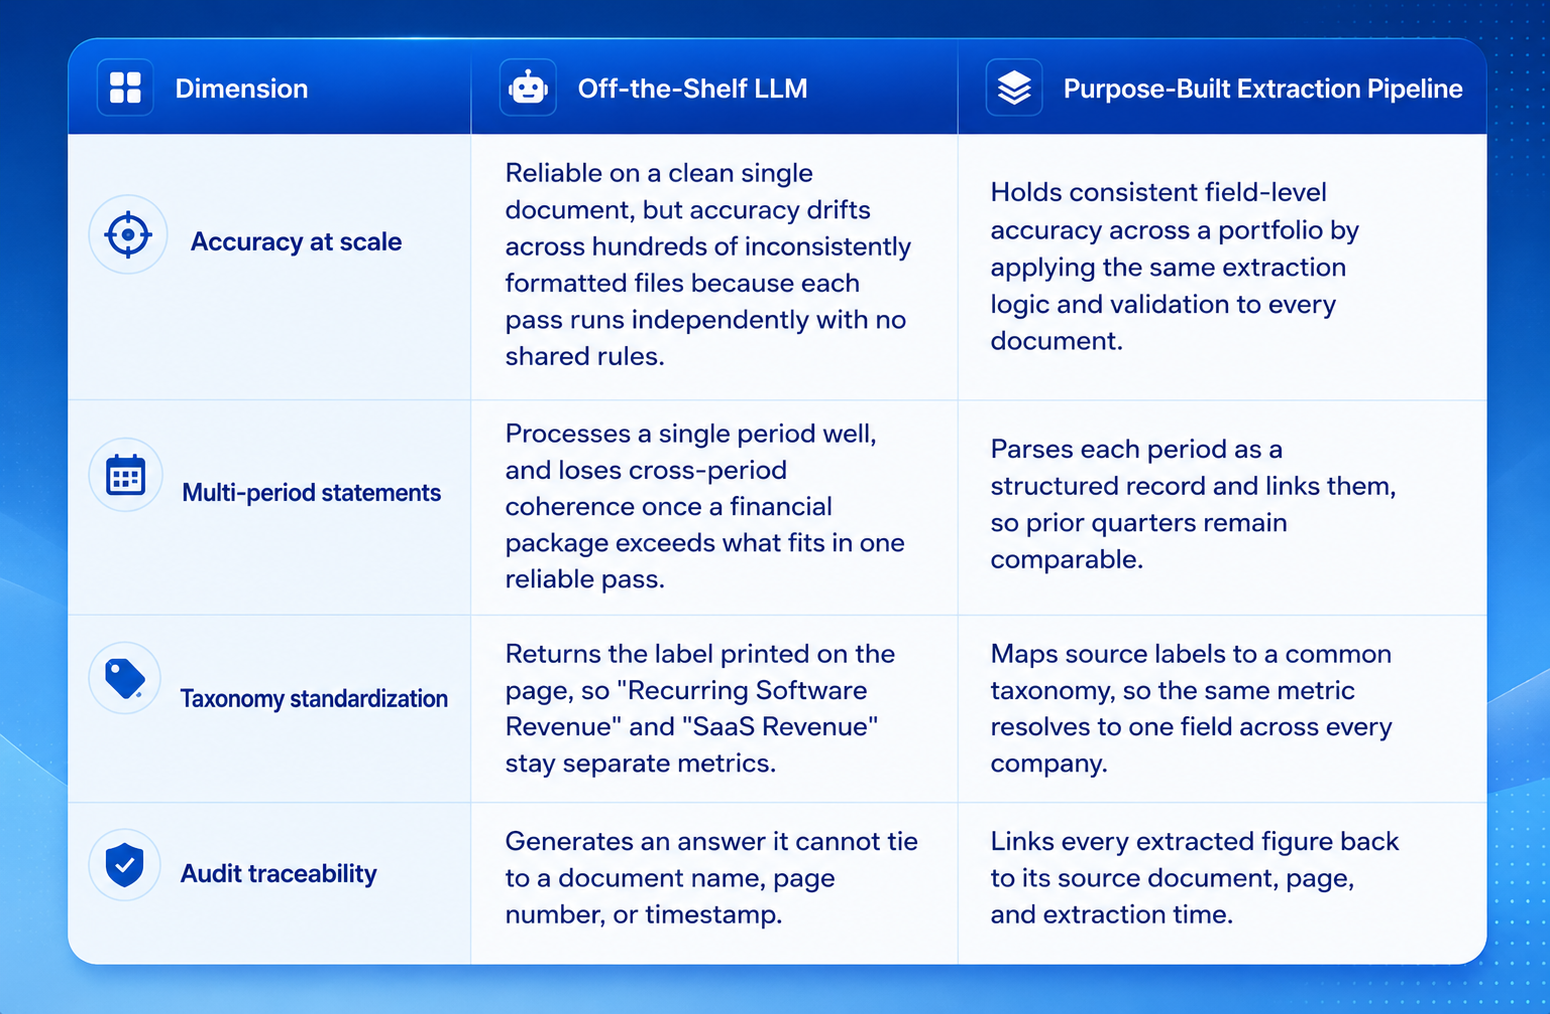
Read down the right column, and you see a production data workflow. Read down the left, and you see a capable assistant for one document at a time.
How to know when you’ve outgrown a general-purpose model
You have outgrown prompt engineering when a general-purpose model stops being a convenience and starts becoming a liability in your numbers. We review some common signs that suggest that this time has come below.
The first sign is portfolio size. Below a handful of companies, one analyst can manually correct a model’s output each quarter and catch most errors by hand. Above it, that manual review queue grows faster than your team does, and the errors you miss become the errors that reach a valuation model.
The second sign is LP reporting cadence. When you owe LPs quarterly figures on a fixed deadline, you no longer have time to re-prompt a model document-by-document and reconcile its inconsistent labels by hand. A reporting calendar demands a repeatable pipeline, not a fresh conversation with a chatbot every period.
The third sign is audit requirements. The moment an auditor or an LP asks where a specific figure came from, a model that cannot name the document, page, and extraction date has failed the test. If you face an annual audit, you need traceability built into the extraction step, not reconstructed afterward.
The fourth sign is error correction time. Track how many hours your team spends each quarter fixing the same column-mapping and label mismatches the model made last quarter. When that number climbs instead of falling, you are paying repeatedly for a problem a feedback loop would have solved once.
A general-purpose model can read your documents. It will summarize a board deck and answer a question about a single statement. The harder requirement is whether its output is structured, validated, and traceable enough to drop into a valuation model or an LP report without a person rechecking every figure by hand. When the answer is no, you have outgrown it.
How Standard Metrics can help
Standard Metrics is a portfolio monitoring platform built for exactly the transition described above, so you can move from document-by-document AI queries about individual portfolio companies to a structured, auditable data pipeline across your whole portfolio.
We use a multi-step AI parsing process that goes beyond basic text extraction: pre-processing splits and classifies documents by type, multiple LLMs handle different stages of extraction, and a managed data services team QAs every output before it lands in your database. The result is accuracy at scale, with every figure linked back to its source document.
Most recently, Standard Metrics expanded this pipeline to board deck parsing. Board decks are historically one of the hardest document types to parse reliably because the visual formatting that makes them readable doesn’t translate cleanly into structured data. Standard Metrics’ approach handles layout-aware processing, fiscal year boundaries, actuals versus forecasts, and unit ambiguity across tables, mapping everything to a common taxonomy so ARR from forty companies rolls up into one comparable field. For firms whose most important KPIs — NRR, ARR, industry-specific metrics — live primarily in board decks rather than financial statements, this closes a significant gap.
If your team is spending meaningful hours each quarter correcting the same extraction errors, or if you’ve hit the point where a general-purpose model’s output needs a person behind every figure before it’s trusted, Standard Metrics is worth a look. Book a demo to see the pipeline in action.
Automate your portfolio reporting
Find out how you can:
- Collect a higher volume of accurate data
- Analyze a robust, auditable data set
- Deliver insights that drive fund performance