

Seven months ago, we launched our Global Benchmarking product, designed to give our users a deeper understanding of private company financial performance within current market context. In this product, we leverage aggregated and anonymized financial data from 8,000+ companies so that startups can benchmark their performance against peers and firms can better contextualize the performance of their portfolio. Benchmarks include key metrics such as runway, burn per FTE, gross margin, and more.
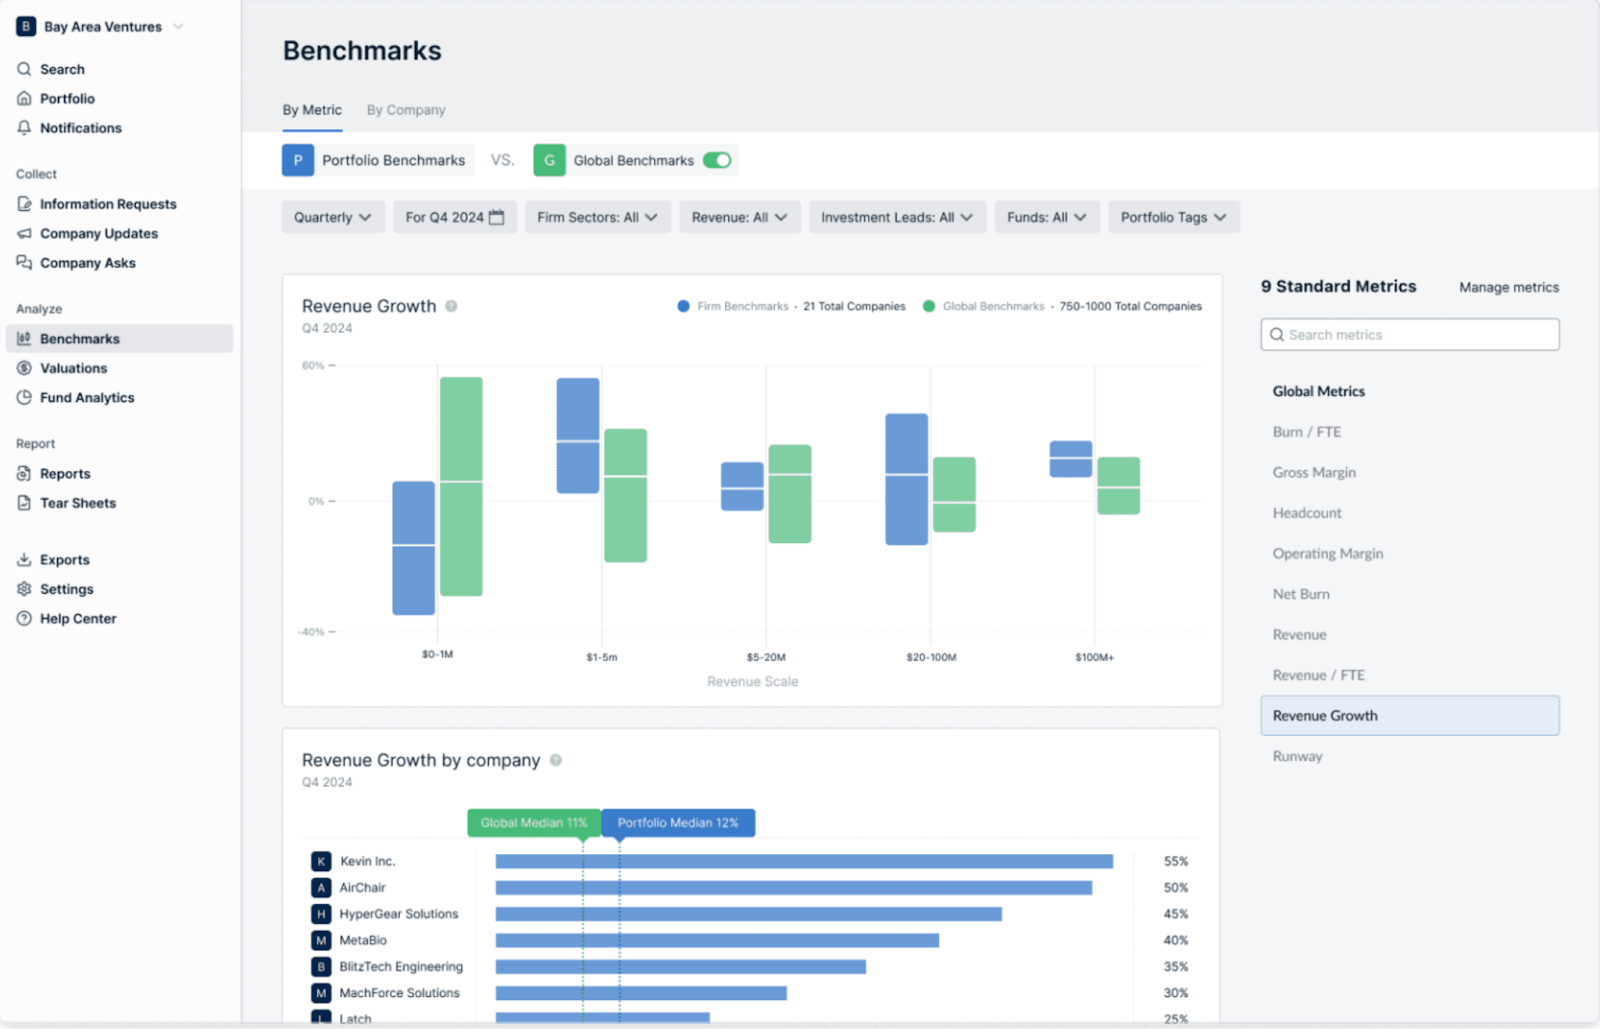
Our initial launch was focused on point-in-time analysis. While we wanted to speak to the right now, we also realized via conversation and close partnership with our customers that historical performance is critical for understanding the full context of a company’s financial metrics. Is an anomalous performance in revenue growth a fluke of a single quarter or a long-term trend, for example?
We’re excited to announce the launch of Trends, a new feature in our Global Benchmarking product that allows you to see a company’s historical performance. You can now see, over time, how a company’s performance compares to data from a large sample of anonymized startups in the same sector and revenue scale.
Trends in action
One major benefit of Trends is that it can help firms and companies better understand long-term performance versus point-in-time phenomena.
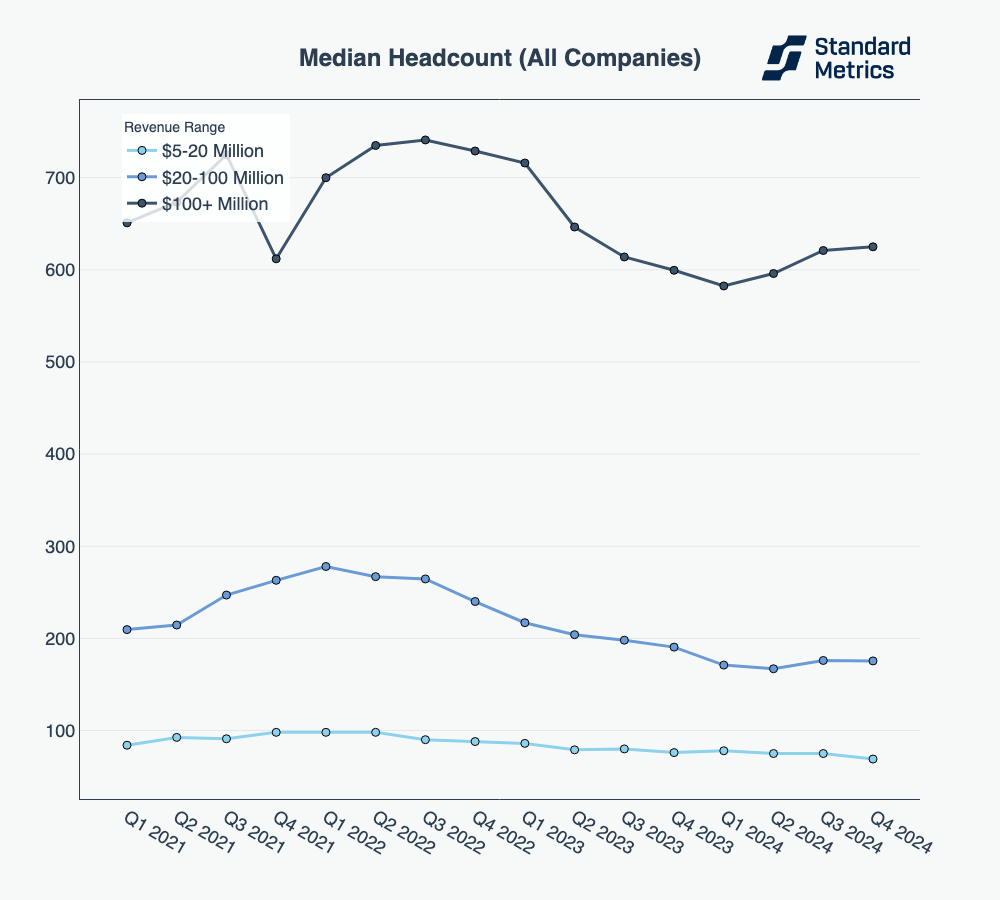
Looking into historical data can show signs of stabilization across a market after periods of fluctuation. For example, median headcount – a metric tracked in Trends – has shifted significantly over the past few years. A team benchmarking their company to Q2 2024 or Q3 2024 data alone might have wondered if we were in the beginnings of a hiring surge and if their portfolio companies should shift towards a more aggressive hiring strategy. But with historical data, firms and their companies can see consistent fluctuations in headcount that suggest a steady hiring plan might be more prudent. And indeed, by Q4 2024, we see that the Q3 uptick looks more like a stabilization in hiring than a true long-term change. Companies aren’t continuing to cut as they did in 2022 and 2023, but they are maintaining carefully right-sized teams for a leaner operational baseline.
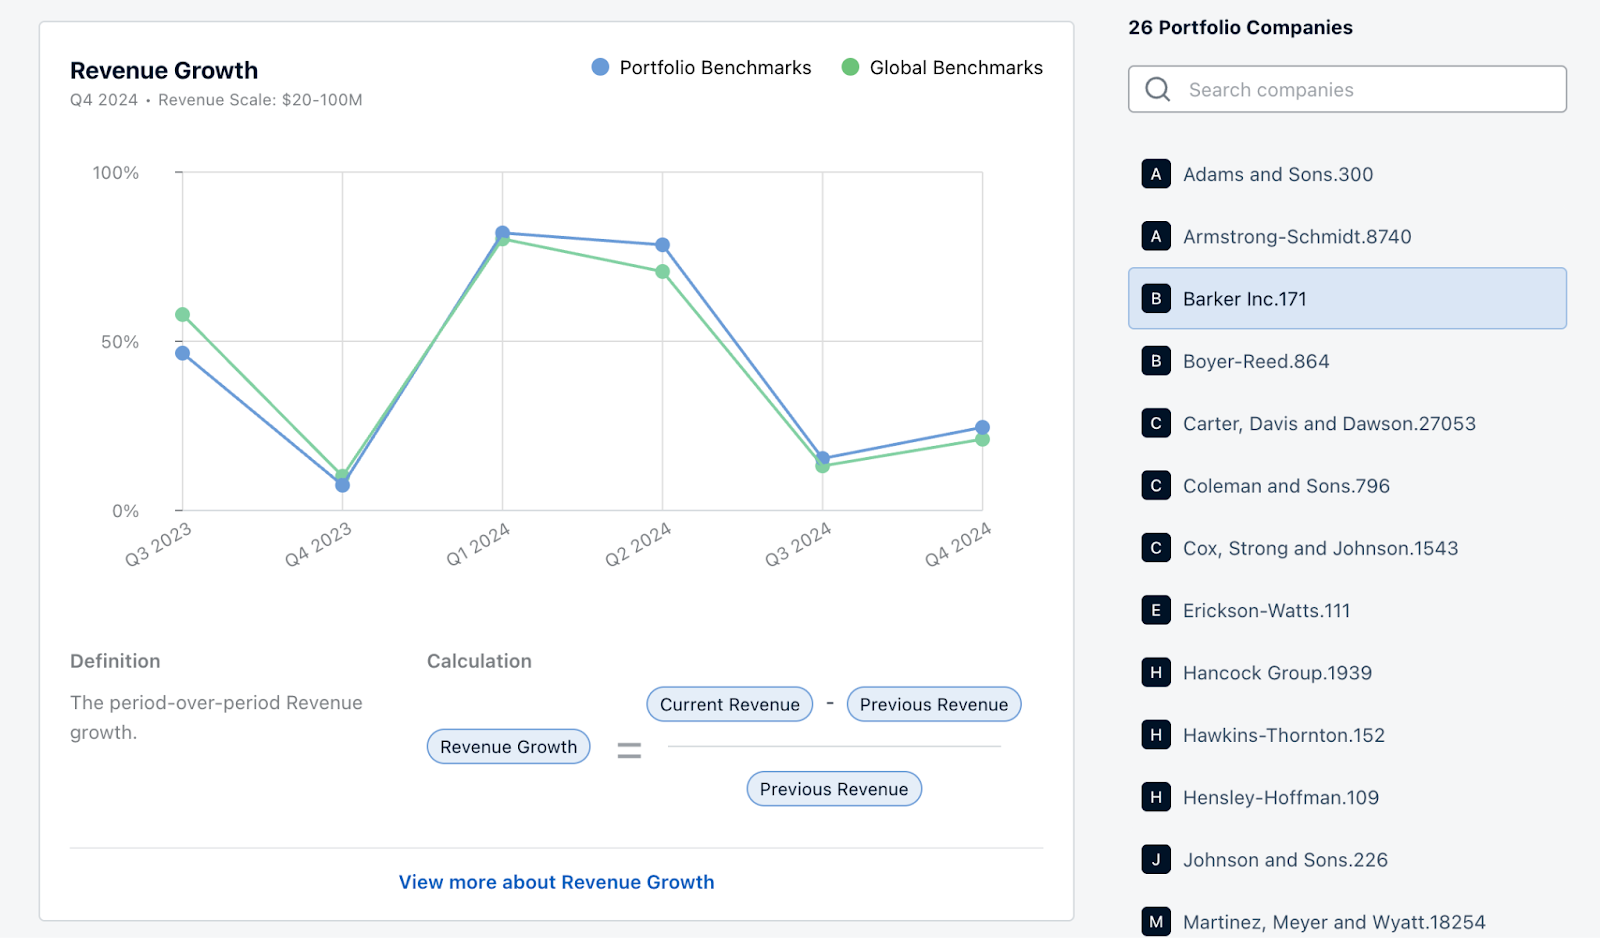
Comparing a single portfolio company to its relevant revenue band and sector on metrics like headcount is a powerful way to establish a relevant benchmark for performance. In the chart below – the visuals you will find in Trends – we can see that our example company (Barker Inc., a SaaS startup with between $20-100M in annualized revenue) has consistently higher headcount than the median of other SaaS startups in the same revenue band, despite broader trends towards a more moderate employee baseline.
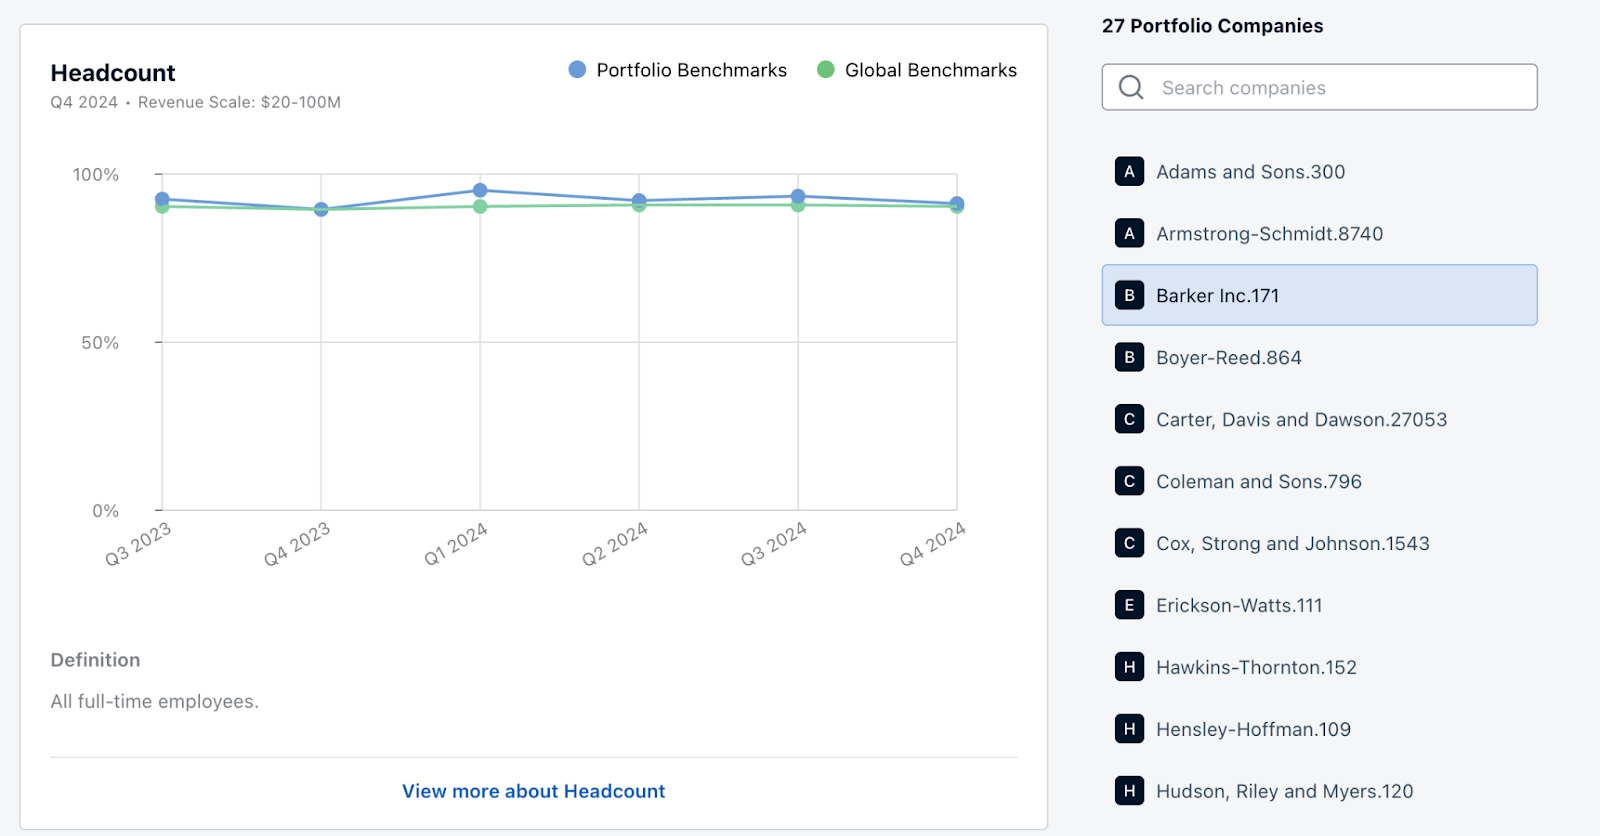
Despite this consistently high headcount, however, revenue growth over time has been spike-y, consistently underperforming peers. Their performance over time on these metrics together may suggest that a conversation between the company and its investor about belt tightening may be in order.
Wrap up
Trends is the latest feature that we hope will continue to improve investor relations between firms and their portfolio companies. With Trends, companies can compare themselves to their peers to understand where they are under or out performing over time. Firms, meanwhile, can contextualize their portfolio’s performance to find portcos that may need help or to find opportunities for follow-on investments. Curious to learn more? Check out our Global Benchmarking tool or get in touch below.
Automate your portfolio reporting
Find out how you can:
- Collect a higher volume of accurate data
- Analyze a robust, auditable data set
- Deliver insights that drive fund performance