Date Published

July 2, 2025

Share this

Standard Metrics has been committed to building interoperable software to facilitate better collaboration between stakeholders in the private markets since day one. We released an API in 2022, an Excel plug-in in 2023, and more recently have integrated with Derivatas, Omni Analytics, and Snowflake. Continuing on this trend, we’re proud to release our new Model Context Protocol (MCP). Your venture-capital data is already in Standard Metrics; now it’s in your AI chat window, too.

Our new MCP server lets compatible clients like Claude Desktop pull Standard Metrics data into secure and permission-aware context so you can ask questions in natural language and get instant, chart-ready answers in the tools you’re already using.


Why we built an MCP server

Many of our customers have an elaborate tech stack of tools ranging from LLMs to AI-powered note-taking apps, where they may want to leverage Standard Metrics’ quantitative and qualitative portfolio company data. Many of these tools (like Claude Desktop or ChatGPT Deep Research) already let you connect with MCP servers where the tools can securely tap into third-party data like Standard Metrics’. We knew an MCP bridge to the Standard Metrics API would:

  • Eliminate copy-paste friction: No more juggling CSVs or browser tabs to explore Standard Metrics’ data in different platforms
  • Respect firm-level permissions: Keep sensitive metrics locked to authorized users while maintaining robust permissions in the Standard Metrics platform
  • Deliver truly conversational analysis: Ask natural-language questions in the chat interfaces you’re already working out of, and get chart-ready answers in seconds

On top of in-app integrations like our embedded portfolio intelligence and AI portfolio company analyst, we also wanted meet users where they already do their prompting.


What you can do with the MCP server

Broadly, the MCP integration allows you to use Standard Metrics data in the tools of your choice, layering the data you have stored on the Standard Metrics platform with the functionality of tools outside of our platform.

Ask Claude or ChatGPT questions about your Standard Metrics data (“List the top five SaaS companies in my portfolio by revenue growth”) and get the answers you need in natural language responses. Layer these tools’ real-time online capabilities into your analysis (“Who are the biggest competitors to these companies right now”) or take advantage of their response styles functionality (”Write a summary of these five companies in my voice for a quick email to another member of my firm”).

Functionality also goes beyond your favorite LLM to other platforms leveraging MCPs like note-taking apps and relationship and deal flow tools. Ask Notion, for example, to pull Standard Metrics data into all relevant documents automatically, eliminating manual workflows and enhancing data retrieval.

Behind the scenes, these tools are using the MCP server to call the Standard Metrics API endpoints, and then synthesize the response into plain-English insights, tables, or exportable visuals.


Configuring with Claude Desktop

While the MCP will allow you to connect to a variety of tools of your choice, many of our customers are particularly excited about the ability to connect with Claude Desktop. A quick how-to:

  • OAuth2 handshake: Generate your Client ID and Secret:
    • On the left hand menu, click on Settings
    • Click on Developer Settings
    • Click “Add Application” in the top right
    • Fill in the application name and description
    • Click “Create Application”
    • Copy your Client ID and Client Secret and store them securely (you won’t be able to see the secret again!)
  • Configuration setup: Add your Client ID and Secret to your claude_desktop_config.json running the MCP with our provided Docker image or pip-installable.
  • Start using it: Once you restart Claude Desktop, you can ask things like “Show me the latest financial data for AirChair”
  • Repeat for other LLMs of your choice: ChatGPT, for example, offers similar functionality.


What’s next

This release is just step one. We plan to continue to improve on our customers’ AI experiences with Standard Metrics data via additional data streams to external LLMs and improving the experience of our in-app AI portfolio analyst.

Have ideas or feedback? We’d love to hear how you’re using the MCP to supercharge your workflows. Drop us a note or open an issue on GitHub: after all, the project is fully open-source.


Automate your portfolio reporting

Find out how you can:

  • Collect a higher volume of accurate data
  • Analyze a robust, auditable data set
  • Deliver insights that drive fund performance


Date Published

June 26, 2025

Share this

Standard Metrics serves as a centralized hub for VC firms’ data (from investment details to portfolio company financials). Historically, we’ve offered our customers various out-of-the-box reports to visualize this data. We’ve also prioritized easy exports along with an Excel add-in and robust API to power quick reporting on other, more customizable data visualization platforms.

Despite these existing tools, our customers continued to demand a higher degree of reporting customizability within the Standard Metrics platform. They wanted to share data in many different formats (presentations, one-sheets, one-off analysis, custom charts, etc.) for many different stakeholders without leaving Standard Metrics.

We considered building out each of the various elements needed to power these tools in-house, but wanted to give our users this functionality as quickly as possible. So we instead began our search for an embedded analytics tool to integrate into our platform — one that would enable our customers to go beyond what we provide out-of-the-box and would help customers easily build their own custom cuts of data, visualizations, and dashboards. One of our key criteria was a flexible UI to empower technical and non-technical users across the firm to answer their most critical portfolio questions. We also needed a tool with an ability to integrate with multiple data warehouses, strong data security, easy data exportability, and AI-related features. Omni, a BI provider fresh off a Series B led by ICONIQ, met the mark.

We’re excited to discuss how this integration will change the Standard Metrics platform, and further our commitment to AI.


Introducing our new portfolio intelligence offering

Standard Metrics will now enable firms to explore, manipulate, visualize, report, and monitor their portfolio companies’ data via a focused reporting and dashboarding solution, all within our platform. On top of saving time and making analysis easier, keeping data on platform also adds to data security (maintaining permissions and traceability unlike an export) as well as metric governance (where data follows the logic and definitions defined in Standard Metrics).

This tool is built with flexibility and easy UX in mind, so non-technical users can also build the visualizations they need. Users can easily drag-and-drop the metrics they want examined into the formats they want them examined in, for example, pulling time into an X-axis and monthly revenue into a Y-axis to form a line chart showing a portco’s revenue over time.

New features are helping our customers to:

  • Pull unique cuts of their data to highlight the metrics that matter most to them, and store these cuts in perpetuity to refer back to (rather than building net new each quarter).
  • Turn their portfolio company data into easily-built, custom visualizations to instantly answer one-off asks from LPs or support unique analysis.
  • Supplement charts with notes explaining qualitative reasons for quantitative performance. These notes can be shared across the firm, so that everyone from analysts to GPs are on the same page about portfolio performance.
  • Share insights with others outside the firm via downloadable charts for presentations, automatic email or slack deliverables, and view-level access invites to dashboards.


AI-powered insights

Leveraging Omni’s AI chatbot, we now enable our customers to ask questions of their data using natural language. For example, simply ask “How does XYZ company’s monthly revenue look over time?” for the helper to build the same chart for you. And because our AI chat is backed by Omni’s built-in semantic model, we’re able to better control the AI’s input and outputs to provide more reliable AI answers built on the context of your business.

Have an idea about a further cut you want visualized (e.g. How does that monthly revenue compare to other companies in my portfolio)? You can also ask the AI bot consecutive questions.


What’s next

With Omni, we’re speeding up data reporting and exploration on Standard Metrics, empowering non-technical users to build insights, and giving the answers to questions that VCs have about their portfolio’s financial health, with just a few clicks.

On top of Omni’s AI-powered insights, Standard Metrics also launched our own AI-powered portfolio company analyst this quarter to help with data summarization at the company level. In real language, ask the bot how a company has performed over time or how it compares to other companies within its industry.

Our advanced analytics currently allows users to analyze their companies performance based on data in Standard Metrics. In the future, we plan to incorporate more fund level analytics and act as an integration hub for all data across a firm.

Get in touch if you’d like to learn more.


Automate your portfolio reporting

Find out how you can:

  • Collect a higher volume of accurate data
  • Analyze a robust, auditable data set
  • Deliver insights that drive fund performance


Date Published

June 16, 2025

Share this

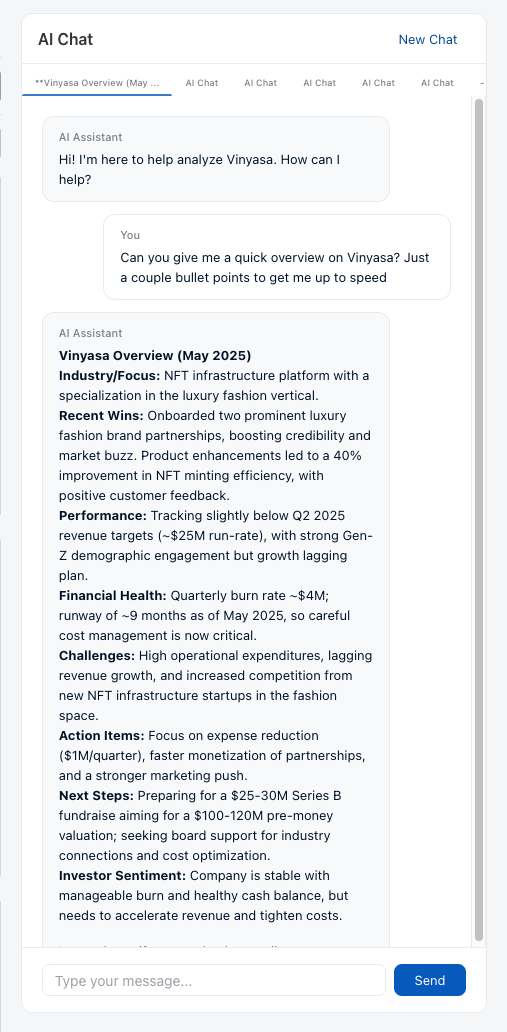
Standard Metrics is excited to launch an AI portfolio company analyst that incorporates both the quantitative and qualitative data customers have stored on platform to help answer questions on their companies via natural language queries.

Standard Metrics has long powered portfolio reporting for leading VC and PE firms, including Bessemer Venture Partners, Accel, General Catalyst, and 8VC. Our platform helps investors automate portfolio reporting, centralize financial and qualitative data, and collaborate more effectively with their stakeholders. Over time, we’ve expanded the platform with features like a robust API for interoperability and embedded BI tools for in-app analysis, helping firms turn static data into actionable insights.

We believe this tool will continue to improve the portfolio reporting experience, helping firms cut down on analysis time required to deep dive into a portfolio company in preparation for LP and internal meetings (e.g. follow-on investment decisions), empowering non-technical teammates with easy-to-use natural language Q&A functionality (vs. queries, spreadsheets, and long documents), and enabling in-platform understanding of a portfolio company’s performance (vs. importing or exporting data for analysis on external LLMs).


What we built

Standard Metrics’ AI portfolio company analyst is just like ChatGPT or Claude, except it knows all about your portfolio companies. Instead of shifting through five different financial statements from a company, ask it: “What is the cash balance for this company over the past 5 quarters?” Instead of reading hundreds of pages of company notes, ask it: “Can you give me a quick overview on this company? Just a couple bullet points to get me up to speed?”

Additionally, we’ve already seen some customers use our AI portfolio company analyst to help with follow-on investment decisions, asking questions like “Do you think we should participate in their next round?” or “What would be a fair price here?”


Our AI portfolio company analyst is:

  • Trend-optimized: Our AI portfolio company analyst incorporates historical company performance data from everything from tear sheets to financial metrics, so insights are built from long-term performance vs. one-off documents.
  • Privacy-minded: Chats are specific to each user, so two users at the same firm will not be able to see each other’s chats.
  • Customizable: Everyone at your firm can use Standard Metrics’ AI portfolio company analyst, but users will only be able to use it for the companies they have access to.
  • User-focused: The AI portfolio company analyst automatically saves your conversation history, accessible anytime via the top bar. Each new chat begins a fresh conversation thread.
  • Part of our core offering: Standard Metrics’ AI portfolio company analyst is available for no additional charge to any firm user already on our platform.


What’s next

We are very excited to continue to iterate and expand on our AI portfolio company analyst. We’re partnering with our customers over the next few months to learn more about how they are using it and what features they’d like to see next.

If you’re a customer, we’d love to hear from you about how you’re using the tool and how we could improve it. If you haven’t yet joined Standard Metrics but would like to learn more, we’d also love to connect.


Automate your portfolio reporting

Find out how you can:

  • Collect a higher volume of accurate data
  • Analyze a robust, auditable data set
  • Deliver insights that drive fund performance


Date Published

April 16, 2025

Share this

Seven months ago, we launched our Global Benchmarking product, designed to give our users a deeper understanding of private company financial performance within current market context. In this product, we leverage aggregated and anonymized financial data from 8,000+ companies so that startups can benchmark their performance against peers and firms can better contextualize the performance of their portfolio. Benchmarks include key metrics such as runway, burn per FTE, gross margin, and more.

Our initial launch was focused on point-in-time analysis. While we wanted to speak to the right now, we also realized via conversation and close partnership with our customers that historical performance is critical for understanding the full context of a company’s financial metrics. Is an anomalous performance in revenue growth a fluke of a single quarter or a long-term trend, for example?

We’re excited to announce the launch of Trends, a new feature in our Global Benchmarking product that allows you to see a company’s historical performance. You can now see, over time, how a company’s performance compares to data from a large sample of anonymized startups in the same sector and revenue scale.


Trends in action

One major benefit of Trends is that it can help firms and companies better understand long-term performance versus point-in-time phenomena.

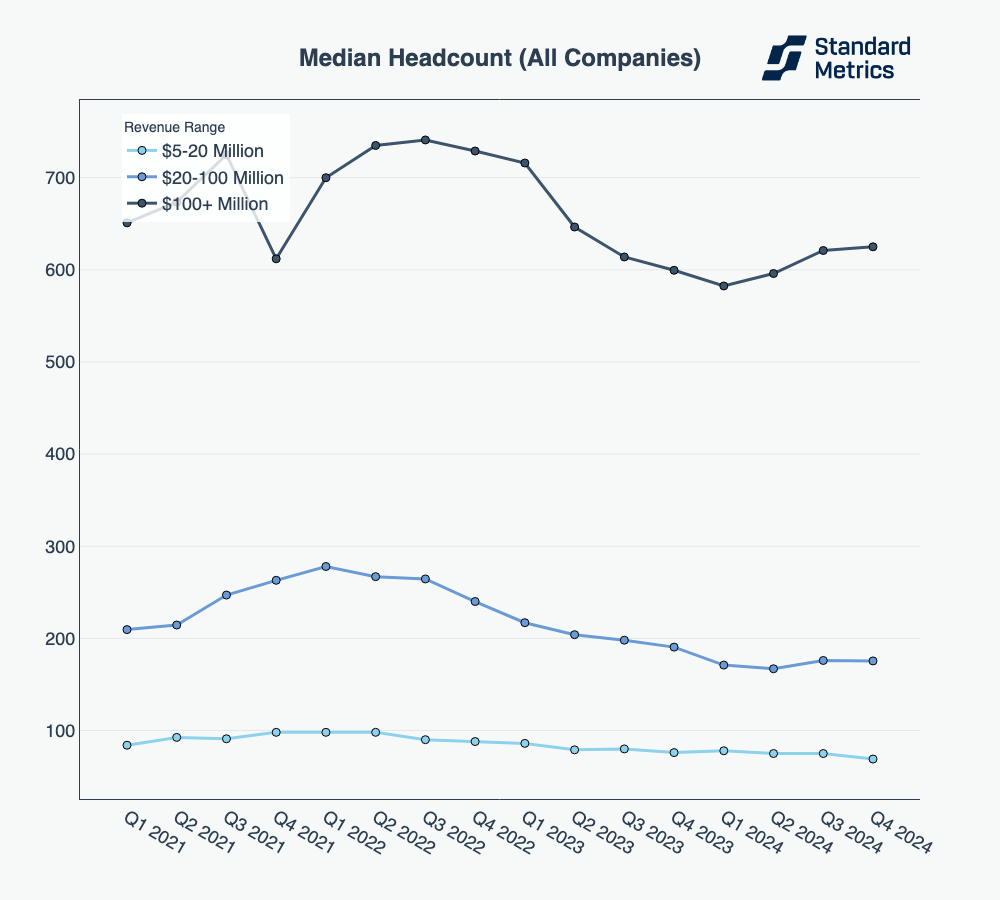
Looking into historical data can show signs of stabilization across a market after periods of fluctuation. For example, median headcount – a metric tracked in Trends – has shifted significantly over the past few years. A team benchmarking their company to Q2 2024 or Q3 2024 data alone might have wondered if we were in the beginnings of a hiring surge and if their portfolio companies should shift towards a more aggressive hiring strategy. But with historical data, firms and their companies can see consistent fluctuations in headcount that suggest a steady hiring plan might be more prudent. And indeed, by Q4 2024, we see that the Q3 uptick looks more like a stabilization in hiring than a true long-term change. Companies aren’t continuing to cut as they did in 2022 and 2023, but they are maintaining carefully right-sized teams for a leaner operational baseline.

Comparing a single portfolio company to its relevant revenue band and sector on metrics like headcount is a powerful way to establish a relevant benchmark for performance. In the chart below – the visuals you will find in Trends – we can see that our example company (Barker Inc., a SaaS startup with between $20-100M in annualized revenue) has consistently higher headcount than the median of other SaaS startups in the same revenue band, despite broader trends towards a more moderate employee baseline. 

Despite this consistently high headcount, however, revenue growth over time has been spike-y, consistently underperforming peers. Their performance over time on these metrics together may suggest that a conversation between the company and its investor about belt tightening may be in order.


Wrap up

Trends is the latest feature that we hope will continue to improve investor relations between firms and their portfolio companies. With Trends, companies can compare themselves to their peers to understand where they are under or out performing over time. Firms, meanwhile, can contextualize their portfolio’s performance to find portcos that may need help or to find opportunities for follow-on investments. Curious to learn more? Check out our Global Benchmarking tool or get in touch below.


Automate your portfolio reporting

Find out how you can:

  • Collect a higher volume of accurate data
  • Analyze a robust, auditable data set
  • Deliver insights that drive fund performance


Date Published

March 11, 2025

Share this

Shine Capital is an early-stage venture capital firm with offices in New York and San Francisco. 

The Shine Capital team sought a founder-friendly portfolio monitoring solution that would automate data collection and reporting. They were looking for a platform that would formalize portfolio tracking and optimize internal processes to address ad-hoc requests from various stakeholders, including Limited Partners. 

“We’re excited to partner with Standard Metrics to institutionalize our portfolio reporting process,” said Amanda Niu, CFO at Shine Capital. “We were impressed by Standard Metrics’ easy-to-use interface for both founders and the Shine team. Their ability to automate data collection and store historical data will be immensely helpful to our team’s portfolio review. We were also glad that a number of our portfolio companies had already been onboarded onto the Standard Metrics platform, which expedited the onboarding process.”

After implementing Standard Metrics, the Shine Capital team will no longer have to spend time manually collecting, consolidating, and reporting on portfolio company performance.  Ongoing KPIs, forecasts, financial statements, and other documents will be structured, stored and easily accessible for portfolio reviews. Shine Capital will also be leveraging Standard Metric’s Benchmarking for portfolio reviews and to help provide guidance to their founders.

“We’re very excited to support Shine Capital as a trusted source for portfolio monitoring and LP reporting” said John Melas-Kyriazi, co-founder and CEO of Standard Metrics. “We deeply admire Shine Capital’s investment approach and commitment to partnering with creative entrepreneurs.”


About Shine Capital: 

Shine is an early-stage venture capital firm that partners with creative, convincing, and relentless entrepreneurs to create iconic businesses. Shine leads inception, seed, and Series A financings and backs partner companies as they continue to perform, maintaining perfect alignment with entrepreneurs. Shine invests in thematic applications of technology that tap into trends across technology, markets, and culture to gain conviction to place non-obvious, high-potential bets. 


About Standard Metrics

Standard Metrics provides a collaboration platform for investors and their portfolio companies. VC firms such as General Catalyst, Salesforce Ventures, and Bessemer Venture Partners use Standard Metrics to collect financial and operational metrics from their portfolio companies. Data collection and structuring is automated. Standardized, auditable metrics are delivered to VC back office teams for easy analysis. On the company side of the platform, startup teams save time by structuring updates once and pushing them to multiple investors.


Automate your portfolio reporting

Find out how you can:

  • Collect a higher volume of accurate data
  • Analyze a robust, auditable data set
  • Deliver insights that drive fund performance


Date Published

March 4, 2025

Share this

At F-Prime, a leading global venture firm investing in transformative healthcare and technology, access to accurate and timely portfolio data is essential. With over 370 companies in its portfolio, having a centralized and reliable data source is crucial.

By eliminating manual workflows, automatically structuring key data, and contextualizing themes with global benchmarking, Standard Metrics will equip F-Prime’s investment and finance teams with a centralized “source of truth” for portfolio metrics. This will enable them to confidently manage their data while focusing on what matters most: identifying new opportunities and driving due diligence.

Andrew Bognanni, Director of Finance, shares, “Our goal is to seamlessly track key investment data across our portfolio and funds to improve internal and external collaboration, increasing our proactive support to all partners.” 

With Standard Metrics, F-Prime aims to elevate its data collection and benchmarking capabilities while setting a new standard for operational efficiency and reporting in venture capital.


Automate your portfolio reporting

Find out how you can:

  • Collect a higher volume of accurate data
  • Analyze a robust, auditable data set
  • Deliver insights that drive fund performance


Date Published

February 20, 2025

Share this

We’re excited to announce our strategic partnership and integration with Derivatas, a leading provider of venture capital valuation software and services. This partnership aligns with our goal of providing a comprehensive system of record and analysis platform for venture capital firms.


Why We Built This Integration

Maintaining accurate, up-to-date portfolio company valuations is a ubiquitous hurdle in the private markets. Collecting the critical underlying financial metrics (revenue, EBITDA, burn, etc.) from portfolio companies is time-consuming, collating those KPIs with investment-level data is manual, and having to maintain up-to-date information across disparate providers is unproductive.

With Standard Metrics and Derivatas partnering together, firms can automate their valuation workflows, more effortlessly maintain a source of truth, and trust that their valuation data is error-free.


How it Works

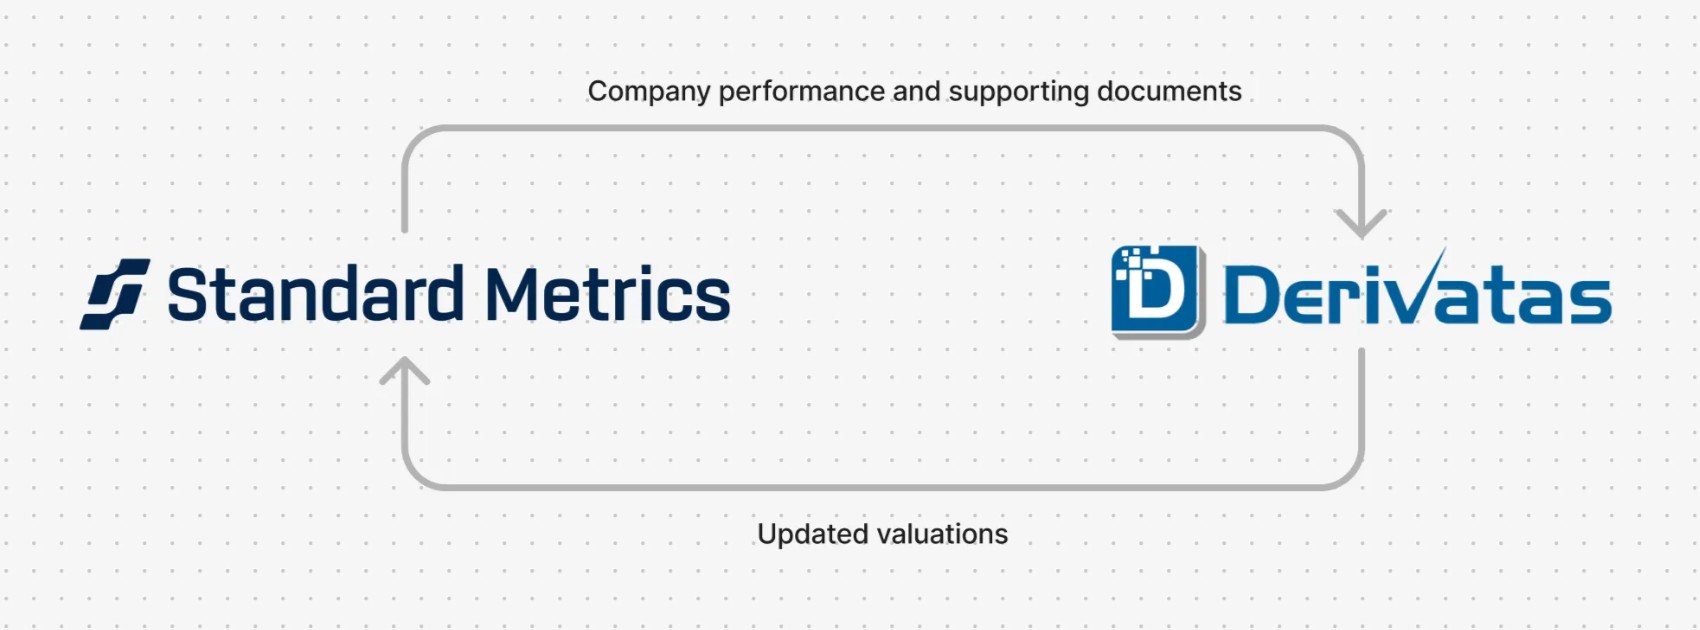
With the click of a button, portfolio company metrics, fund information, and relevant documents from Standard Metrics will sync with Derivatas’ valuation module, ensuring accurate valuations with minimal manual effort.

This integration delivers several key advantages for our shared venture capital customers:

  1. Time Savings: eliminate manual data entry and reduce the time spent on quarterly valuation processes
  2. Worry-free reporting: automated data synchronization minimizes the risk of data entry errors
  3. Enhanced Analysis: enable more timely and accurate portfolio performance analysis for GPs/LPs


Looking Ahead

This partnership represents our commitment to providing venture capital firms with the most comprehensive and efficient tools for portfolio management. By combining Standard Metrics’ powerful portfolio monitoring capabilities with Derivatas’ expertise in valuations, we’re turning the traditionally onerous quarterly valuation process into a stress-free, streamlined experience for mutual customers.

Contact success@standardmetrics.io or inquiries@derivatas.com to learn how this integration can streamline operations for your firm today.


Automate your portfolio reporting

Find out how you can:

  • Collect a higher volume of accurate data
  • Analyze a robust, auditable data set
  • Deliver insights that drive fund performance


Date Published

February 5, 2025

Share this

Kineo Finance is a global financing firm headquartered in Basel, Switzerland, with subsidiaries in Munich, London, and San Francisco. With a specialization in early-stage hardware companies, the firm provides flexible financing solutions across the capital structure, helping founders scale efficiently without unnecessary dilution. Kineo’s hands-on approach extends beyond capital—they actively support portfolio companies in navigating market entry, optimizing recurring revenue models, and achieving long-term, sustainable growth. 

Kineo’s Finance team sought a founder-friendly portfolio monitoring solution that would automate both data collection and reporting. After one of the firm’s portfolio companies praised Standard Metrics for its seamless experience and facilitated an introduction, Kineo recognized the potential to modernize its processes. Implementing the platform would not only ease the firm’s own reporting workload, but also reduce the reporting burdens of every founder it supports. By streamlining investor relations and enhancing transparency between firms and their portfolio companies, Standard Metrics ensures that credit funds gain real-time visibility, standardized insights, and a frictionless experience—just as their equity counterparts do.

“At Kineo, we’re constantly searching for ways to optimize our operations; and for a distributed team, portfolio management is a key aspect of those operations. By implementing Standard Metrics, we not only streamline the portfolio monitoring process; we also provide ourselves with a means of turning our portfolio data into portfolio knowledge. Rather than chasing data, we can use that knowledge to focus on supporting our portfolio companies’ growth. We look forward to the efficiency and continued collaboration of this partnership.” – Charles Sellman, President, Kineo Finance USA

With Standard Metrics in place, the Kineo Finance team can eliminate the time-consuming process of manually gathering, consolidating, and reporting portfolio data each quarter. Instead of being distributed throughout dozens of folders and overlapping files, critical documents such as financial statements and forecasts will be structured, stored, and centrally accessible for real intelligence gathering and meaningful insights. Standard Metrics will provide a single source of truth for KPIs and investment data, and Kineo’s portfolio companies will benefit from a streamlined portal for seamless investor reporting.

“Kineo Finance is committed to driving innovation with customized financing solutions,” says John Melas-Kyriazi, co-founder and CEO of Standard Metrics. “With expertise in innovative asset financing and a relentless dedication to client success, they have established themselves as leaders in the field. We’re thrilled to contribute to their mission by providing a seamless, data-driven approach to evolving portfolio management.”


About Kineo Finance

Kineo Finance is an international financing partner headquartered in Basel, Switzerland, with subsidiaries in Germany, the UK, and the USA. Kineo specializes in innovative asset financing for technology companies, offering customized solutions in venture leasing, factoring, working capital, and equity investments. Kineo is committed to supporting companies in accelerating their market entry and achieving sustainable, enduring growth. With a team of over twenty-five professionals, Kineo Finance is a trusted partner in driving growth.


About Standard Metrics

Standard Metrics empowers investors with a unified platform that fosters seamless collaboration with their portfolio companies. Leading VC firms like General Catalyst, Salesforce Ventures, and Bessemer Venture Partners leverage Standard Metrics to effortlessly collect and structure financial and operational data. Automation accelerates data collection and delivers standardized, auditable metrics that offer VC back-office teams immediate, actionable insights. On the startup side, company teams save valuable time by structuring updates just once, then effortlessly sharing them with multiple investors, optimizing efficiency and transparency across the board.


Automate your portfolio reporting

Find out how you can:

  • Collect a higher volume of accurate data
  • Analyze a robust, auditable data set
  • Deliver insights that drive fund performance


Date Published

December 10, 2024

Share this

Lux Capital is a venture capital firm based in New York City and Silicon Valley with $5+ billion AUM, investing in emerging science and technology companies at the outermost edges of what’s possible.

The Lux portfolio includes category-leaders such as Anduril, Runway, Eikon Therapeutics, Hugging Face, and Databricks. Today the firm has more than 30 full-time professionals with a wide spectrum of technical backgrounds and over 200+ portfolio companies.

The Lux team sought a solution that would help offer a user friendly, customizable and interoperable solution for their front, middle, and back office teams.

“We’re thrilled to partner with Standard Metrics to streamline our portfolio monitoring process,” said Segolene Scarborough, Chief Financial Officer at Lux Capital. “After extensive platform demos, what stood out was their remarkable flexibility and robust feature set. Their hands-on customer support, combined with the platform’s ability to automate data collection, will significantly reduce the administrative burden on our portfolio companies while enhancing our internal monitoring capabilities.”

With the Standard Metrics platform, Lux Capital’s portfolio companies will be able to save time by replacing their current manual reporting process while offering new benchmarking insights and a source of truth when it comes to company performance.

Once implemented, the Lux Capital team will leverage Standard Metrics as their source of truth for KPIs and investment data, and to streamline their audit, LP reporting, and portfolio reviews.

“The optimism and technology-forward approach that Lux Capital brings to its investments is inspiring” said John Melas-Kyriazi, co-founder and CEO of Standard Metrics. “We’re honored to support Lux and their portfolio companies as they push the envelope of what’s possible and work to create a better future for all of us.”


About Lux Capital

Lux Capital is a venture capital firm investing in emerging science and technology at the outermost edges of what is possible. They partner with iconoclastic inventors who challenge the status quo and the laws of nature to bring their futuristic ideas to life. Over the past two decades, Lux has expanded from its New York City roots to Silicon Valley, and built a $5+ billion AUM firm of more than 30 full-time professionals, with a wide spectrum of technical backgrounds and the versatility to invest at any stage.


About Standard Metrics

Standard Metrics provides a collaboration platform for investors and their portfolio companies. VC firms such as General Catalyst, Salesforce Ventures, and Bessemer Venture Partners use Standard Metrics to collect financial and operational metrics from their portfolio companies. Data collection and structuring is automated. Standardized, auditable metrics are delivered to VC back office teams for easy analysis. On the company side of the platform, startup teams save time by structuring updates once and pushing them to multiple investors.


Automate your portfolio reporting

Find out how you can:

  • Collect a higher volume of accurate data
  • Analyze a robust, auditable data set
  • Deliver insights that drive fund performance

Date Published

September 24, 2024

Share this

For Data Collective Venture Capital (“DCVC”), a firm that invests in technology sectors such as AI, robotics, and computational biology to address complex global challenges, having access to accurate and up-to-date investment data is crucial.

By eliminating manual workflows, reducing data entry pain points, and simplifying the migration of outdated contacts from a legacy tool, Standard Metrics has provided DCVC’s investment and finance teams with a centralized “source of truth” for portfolio metrics. This empowers them to confidently manage their data, saving time for what matters most: sourcing new opportunities and driving diligence work.

With Standard Metrics, DCVC is ready to collect data and benchmark portfolio company performance effortlessly, setting a new standard for how venture capital firms operate and report.


Automate your portfolio reporting

Find out how you can:

  • Collect a higher volume of accurate data
  • Analyze a robust, auditable data set
  • Deliver insights that drive fund performance