Why The Best VC Fund Management Software Matters More Than Ever
The venture capital landscape has changed dramatically since 2021’s highs. Fewer deals and funds are capturing the lion’s share of dollars, liquidity remains scarce, and dicey macroeconomic conditions loom large. Despite these headwinds, AI has been a strong tailwind, catapulting Cursor to $100M of revenue in its first year and Intercom’s “decelerating” 8-figure ARR business to a 393% annualized growth rate. These factors—combined with the explosion of private market data and the new leverage that modern tooling gives investment firms—are forcing VCs to rethink their edge, adopt new investment strategies, and implement innovative technologies to succeed. Even established firms, often insulated from fundraising headwinds, are adjusting to the reality that venture is no longer a cottage industry: it’s become a full-fledged, competitive asset class.
As VCs scramble to find alpha and capture beta in this hyper-competitive, ever-challenging environment, a shift to automated, data-driven, portfolio and fund management has emerged. Legacy software has become a barrier to insight and speed. Manual fund management across spreadsheets, email, and board decks is now a liability, not a cost saver. Data is suddenly fueling investment decisions, not just back-office compliance. Firms are modernizing their tech stacks and operational processes across all categories, from sourcing to supporting, and finding the right software to help manage it all has become paramount.
We’ve witnessed venture’s dramatic evolution since launching Standard Metrics in 2020 by working hand-in-hand with over one-hundred leading investment firms (Accel, Bessemer, General Catalyst, etc). These conversations, paired with the challenges we’ve solved for our VC customers, have given us a deep appreciation for the operational complexity behind fund management. We wrote this guide to democratize these insights and help all VCs navigate the rising unknowns and urgency around getting fund management right.
How to Choose The Best VC Fund Management Software
Venture’s maturity as an asset class has spurred the development of industry-specific tools across every fund management niche. Unfortunately for GPs, CFOs, and COOs at VC firms, this plethora of software has inadvertently made it harder on firms to advance into the digital era with confidence. Resources like VC Stack help map the market but with 100+ different solutions listed, we wanted to provide a resource that helps VCs know what to look for and where to start.
Considerations Ahead of Evaluating VC Fund Management Software
1. Clarify End Users and Stakeholders
Before talking to vendors, productive VC tech stack buildouts begin with an honest discussion about who will manage, use and benefit from new software and services. Consider the daily workflows and challenges faced by different personas, such as your finance teams who are responsible for timely quarter and year-end reporting, or your deal teams who need sophisticated pipeline tracking and due diligence capabilities. Additionally, reflect on benefits to secondary stakeholders, like LPs who increasingly expect transparent, real-time performance insights, founders who would appreciate intuitive interfaces for hassle-free reporting, or auditors who will love being able to see the full picture of a datum’s source, history, and changes. Understanding each stakeholder’s distinct needs and pain points will not only make it easier to sell internally but ensure the chosen solution will genuinely enhance operational efficiency, investment decision-making, investor relations, and founder/portfolio company support.
2. Align Software Requirements with Your Firm’s Stage
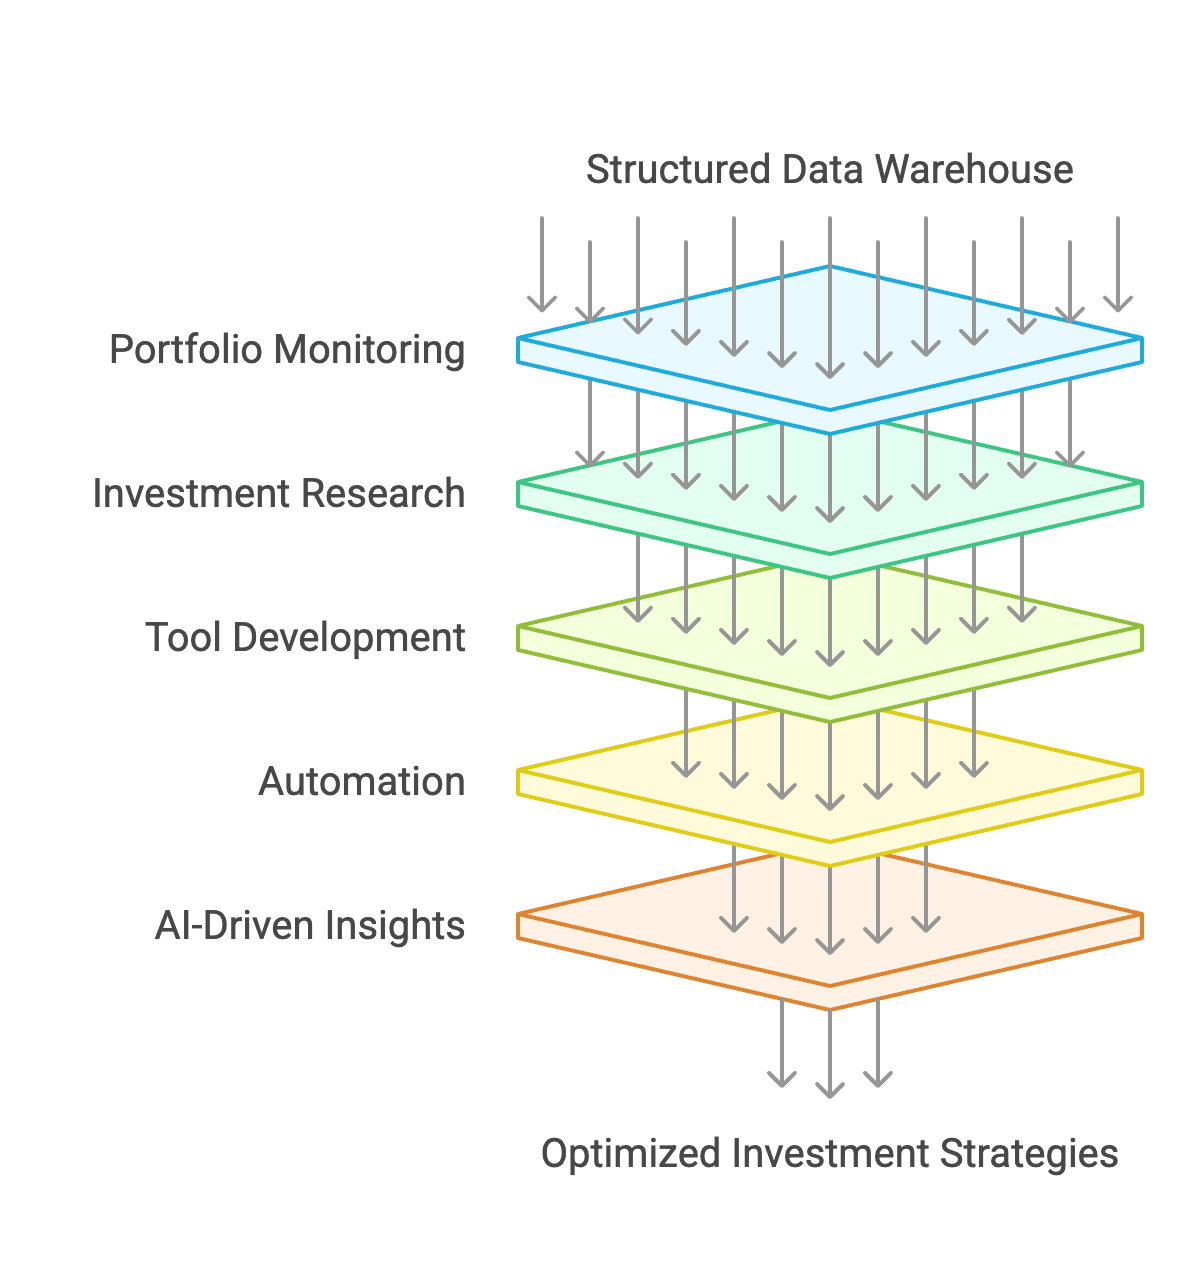
The stage and maturity of your fund directly influence the features and capabilities you should prioritize when building out a VC stack. While first-time managers can manage with basic tools like spreadsheets and Notion, manual systems sacrifice speed, accuracy, and insights. That’s why emerging funds deploying capital should implement tools that scale with portfolio growth, whether that’s through automating data collection, call recording and summarization, or fund admin tasks that rapidly become time-consuming. Mature, later-stage funds should implement best-in-class tools across each vertical, layering a data warehouse on top to run complex queries across multiple datasets, identify trends and performance metrics with ease, and generate custom reports quickly. Carefully matching a software’s capabilities to your fund’s current position and anticipated evolution prevents costly misalignment, future-proofs your investment, and enables time to stay focused on what matters: investing in companies to generate returns for LPs.
3. Strategically Evaluate the Build-vs-Buy Decision
Deciding whether to build a homegrown fund operations platform or adopt off-the-shelf software is a pivotal decision for any venture firm. The right path depends on a fund’s strategic vision/brand, internal engineering/operational capabilities, and budget. It’s true that building a custom VC stack can unlock tailored workflows across deal sourcing, due diligence, portfolio company tracking, LP reporting, etc; however, this route demands substantial upfront investment, ongoing engineering resources, and the ability to navigate R&D complexity without disrupting core investment activities. On the other hand, leveraging a commercial all-in-one solution or a modular suite of best-in-class tools can help firms stay focused on investing, reduce operational overhead, and benefit from evolving industry-wide standards. Thoughtfully evaluating these trade-offs in light of your fund’s size, in-house expertise, LPA, and long-term growth plans ensures you don’t overextend resources on software development, while still building an operational foundation that scales with portfolio growth.
4. Avoid These Pitfalls When Evaluating Fund Management Software
Firms should avoid the following mistakes when evaluating fund management software. The first is vetting tools alone versus looping in other, likely to benefit stakeholders. Often, any decision regarding the broader VC tech stack will have a wider impact than it at first seems. Moving to a new KPI reporting platform, for instance, may not only impact finance workflows, but those of investors, IR, Platform and more. Second, firms should demand transparency around how pricing will scale as their portfolio and/or team grows, clarifying upfront how their contract will change at renewal and scale over the course of its lifetime. Third, while initial costs might appear high, proactively investing in software robust enough to handle future growth often proves more economical than selecting cheaper alternatives that soon require disruptive and costly replacements. Fourth, and related to the first, another pitfall is purchasing solutions without the resourcing or stakeholder buy-in to fully implement and derive value. This is when purchasing CRM, fund accounting, portfolio management and other technology with dedicated support and implementation managers pays dividends. Lastly, firms should insure their evaluations by not overlooking a vendor’s product roadmap, shipping velocity (often a function of team size), capitalization, and long-term support capabilities. This oversight can lead to dissatisfaction down the line if the chosen platform fails to evolve alongside the firm’s growing operational and strategic needs. Stay mindful of these pitfalls to make more informed, strategic decisions about fund management buildouts.
What to Look For When Evaluating VC Fund Management Software
1. Founder-friendliness
Firms must not overlook the portfolio company experience when implementing new fund management software. From platform initiatives to investment team workflows, even well-intentioned decisions can inadvertently create friction for founders. Whether it’s requesting repetitive, custom data to satisfy internal reporting, exposing founders to misleading benchmarks for guidance, or clarifying something that a founder shared on a call, the cumulative burden adds up. As such, software should not only be intuitive, it should be streamlined, insightful and valuable. That is possible by implementing solutions designed for founders, not just branded as founder-friendly. Stay cognizant of features like direct accounting integrations, global benchmarking insights, action-item summaries, and flexible document ingestion to ensure fund ops decisions stay as frictionless as possible for founders. Software should enrich, not burden founders’ lives. Don’t lose sight of the fact too that providing a best-in-class experience to portfolio companies confers benefits to VCs as well, primarily greater trust and a greater likelihood that more data is shared, on-time and accurately, for portfolio reporting and analysis.
2. Implementation Process
Implementation is not often discussed until deep into the buying process, but it can be a hidden, hefty headwind for investment firms building out their tech stacks for the first time, especially those without dedicated IT departments. That’s why it’s important early in the vendor evaluation process to diligence numerous providers and speak to references (ideally firms similar in size/structure) about their onboarding processes. How long did it take to reap benefits versus what was promised? What was the lift required from each party? Who were the stakeholders that needed to be involved? Self-serve solutions generally provide less onboarding guidance and handholding, while premium, enterprise-grade solutions have dedicated implementation teams handling a lot of the fund ops work, without costly delays and accuracy issues. It’s important to ask these hard questions upfront to prevent fund ops fires down the line: prolonged rollouts erode internal momentum, jeopardize executive buy-in, and can reflect poorly on internal advocates, especially if roles or priorities shift mid-project.
3. Product Robustness, Scalability, and Shipping Velocity
Buying venture capital fund management software can seem like a binary, obvious decision: does this product meet, or not meet, our needs? Unfortunately for fund managers, that snapshot view misses three deeper dimensions that are critical for long-term success. The first and most obvious is product robustness: how easy is the product to use; how many core problems does implementing it fix; is it offering institutional-grade, or marginally better features, and more. Remember, even a single bad experience, lack of customization, data inaccuracy, latency or security issue can erode trust and create blockers. Second, scalability defines how well the platform will handle investment and firm-level growth: whether you’re aggressively deploying, starting to deploy across several vehicles, adding more users with varying permissions-levels, etc., a truly scalable system spares you from costly re-platforming, ensuring consistent performance under rising load and expectations. Finally, shipping velocity, which signals a vendor’s ability to stay ahead of evolving market table stakes, integrate with other systems, and continually automate manual workflows for VC teams. Get a sense for that by talking to customers, looking at how many engineers work at the company, and understanding if there has been an acquisition recently which may temper support and product velocity down the line. When robustness, scalability, and shipping velocity become separate checkboxes, you secure a reliable foundation for today’s workflows while preserving optionality for future growth.
4. Interoperability
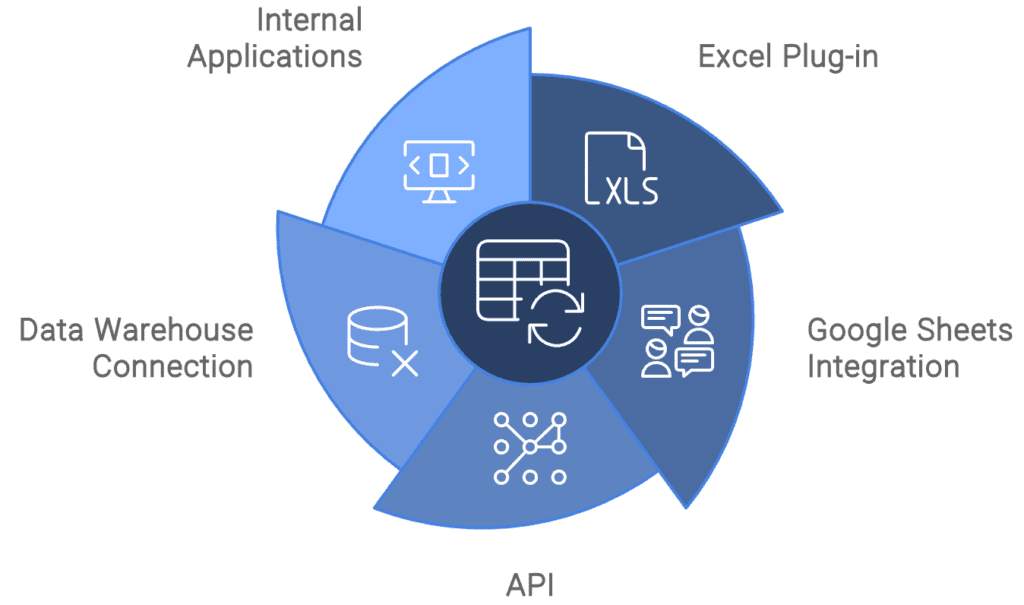
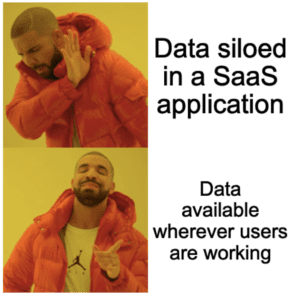
Interoperability, the ability of fund management software to seamlessly exchange data and interact with other systems, is non-negotiable for modern VC firms because it underpins operational efficiency, portfolio insights, and strategic flexibility. By insisting on well-documented APIs, plug-ins to tools like Excel, and providers across different verticals (e.g. Derivatas), firms can eliminate manual, duplicative fund ops work that introduces errors, delays, and obfuscates decision-making. Interoperability also guards against vendor lock-in: if your needs evolve or a better, more specialized tool emerges, you can swap components in and out of your tech stack without costly migrations and bespoke engineering work. Furthermore, integrated systems empower teams to build end-to-end automated workflows—KPIs collected via Standard Metrics can be ported to Derivatas for a valuation, then sync back automatically and transparently to Standard Metrics, for example. In an environment where speed, accuracy, and transparency can make or break fundraising and effective portfolio management, demanding interoperability from vendors ensures firms can adapt quickly to new data sources, regulatory requirements, and market opportunities without being hamstrung by siloed software and systems.
5. Platform Support
Support—spanning implementation, ad hoc troubleshooting, and ongoing account management—can make or break an experience with fund management software. Having a trusted, expert resource from contract signature and beyond to navigate project planning, data migration, user training and instance configuration will ensure firms go-live on time and on budget. Once live, responsive ad-hoc support for unexpected technical issues (reporting glitches, API hiccups, permissions snafus, etc) is crucial to minimize downtime and prevent small problems from snowballing into major workflow disruptions. Lastly, a dedicated account manager can serve as a strategic partner. Ideally on-shore domain experts, they understand each firm’s unique fund structures and processes, advocate for needs in a vendor’s hotly-contested product roadmap, proactively surface new features and best practices, and coordinate cross-functionally to keep systems optimized. By insisting on full-cycle support, VC firms can safeguard, improve and streamline daily operations to maximize a software’s value over the long term.
Evaluating ROI With New VC Fund Management Tools
1. Cost of Status Quo
Many VCs demand quantifiable ROI for new fund-management tools but rarely account for the opportunity cost of keeping their legacy systems and manual processes. The truth is that each hour spent across spreadsheets and email—whether that’s chasing founders down to share data, tracking carry, managing fund waterfalls, or finding pathways for an introduction—is a lost hour of return-generating sourcing, diligence and checkwriting activities. This can prove costly due to venture’s power-law: missing one good deal due to low-value portfolio management work can make or break fund returns. Additionally, manual fund management can obfuscate portfolio risks and opportunities, which can materially impact a fund’s returns if spotted and acted on early. Lastly, manual fund management also has the aforementioned, adverse impact on founders. It not only distracts firms from supporting portfolio companies, it distracts portfolio companies from productive operating activities. Recognizing these truths before and during an evaluation can make an ultimate software purchase easier to justify.
2. Benefits With New VC Fund Management Software
Now that the opportunity cost of manually managing a fund is understood, the benefits on the flip side of the coin are more obvious. And while quantifiable ROI will ultimately vary firm to firm, each should recognize the likely gains across the following areas and work with vendors to construct a more exact, bespoke picture of ROI. It’s helpful to remember that clean portfolio data and a robust, tightly integrated VC stack powers all activities at a firm: sourcing, diligence, LP reporting, audit, valuation, portfolio reviews, board meetings, fundraising, and forecasting so these decisions should not be taken lightly.
I. Operational Efficiency
Automating manual VC workflows gives firms time back to focus on the high-value tasks conducive to generating returns (e.g. meeting with founders and investing), while gaining a foundation that scales with portfolio growth.
II. Cost Savings
Reducing the time that VCs spend on low-value fund ops work is cheaper than adding additional headcount to manually manage growing portfolio management workloads.
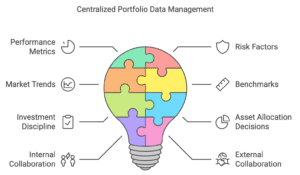
III. Central Source of Portfolio Truth
Minimizing internal (GP/Finance/Ops/Partner) misalignment regarding the state— and future state—of the portfolio ensures everyone is on the same page, without frivolous back-and-forth liaison.
IV. Spot Investment Opportunities and Risks
Having a clear, dynamic view into the portfolio helps investment firms proactively address at-risk companies and double-down on outperformers early.
V. Reduce the Portfolio Company Reporting Burden
Intuitive, founder-friendly reporting interfaces help investment firms collect more data on company performance and also makes reporting a valuable, streamlined exercise for founders through direct accounting integrations, flexible document parsing, and robust KPI benchmarking.
VI. Enhance LP and Auditor Relationships
Robust, accurate, and traceable portfolio data fosters trust with LPs and auditors who are increasingly expecting timely, detailed reporting and compliance.
Thoughtfully taking each of these benefits into account and constructing a narrative as to which matter the most can help investment firms zone in on the most important issues they’re looking to solve and make the case for why certain tech should be implemented now versus later.
Where VC Fund Management Is Getting Disrupted
The surge of specialized private-market tooling and data was already rendering legacy private-equity software obsolete, but now that AI has entered the picture, the bar for speed, accuracy, and insights is even higher, leaving firms that cling to outdated systems at a severe competitive disadvantage. Every prudent VC fund manager is implementing AI across their tech stacks, and early adopters are compounding operational knowhow, streamlining fund ops, and improving decision-making by modernizing workflows. Understanding the different areas that are being impacted and the right tech to use in each vertical is crucial.
Portfolio Management
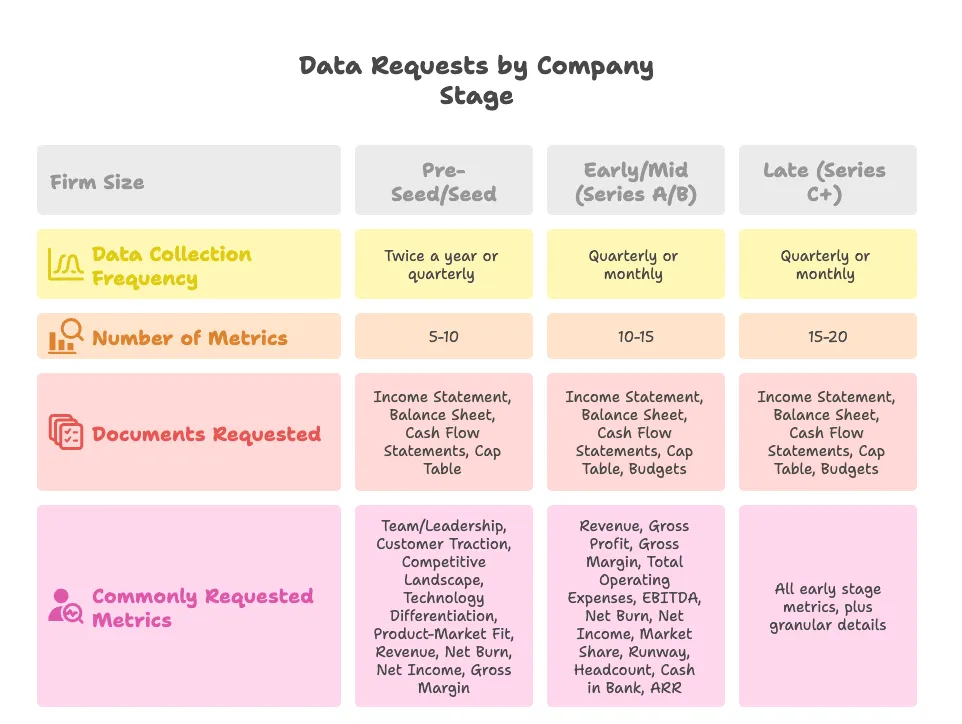
Portfolio management in VC involves overseeing and supporting the startups a firm has invested in. This includes managing and monitoring key performance metrics, key investment-level information, portfolio company milestones, and providing guidance or resources to help startups grow. Effective portfolio management not only is streamlined but aims to maximize fund returns by nurturing winners, helping underperformers early, and planning timely follow-on investments. Due to the sheer volume of portfolio and investment level data that VCs are tasked with organizing, VC portfolio management is ripe for automation and consolidation. Modern providers like Standard Metrics are now implementing AI features—like financial document parsing—to inject even greater efficiency and prescience into portfolio management.
CRM / Deal Flow
Venture CRM and deal flow management refer to how venture capital firms handle their pipeline of potential investments and relationships. This function involves tracking startup prospects, managing interactions with founders and co-investors, and moving deals through stages from sourcing to due diligence to closing. A well-structured deal flow process helps VCs efficiently filter a large funnel of opportunities into a few high-potential investments. Since modern VCs are confronted with an overwhelming amount of information across calls and meetings, manual tracking is downright inefficient. AI-first venture capital tooling is upleveling this function by intelligently screening opportunities (see Affinity’s new sourcing product), preparing for and summarizing meetings, uncovering high-potential startups with simple queries (see Hamonic AI’s Scout, and more.
Fund Accounting / Administration
Venture fund accounting and administration involve managing capital calls and distributions, keeping the financial records of a fund(s), tracking carry, handling portfolio company valuations, and preparing reports for LPs, regulators and GPs. It is detail-intensive work that must be accurate, comply with accounting standards, and delivered on a timely basis. Since these workloads are heavy with repetitive, data-intensive tasks, fund accounting and administration is a prime function for automation. Many firms still rely on manual data entry, reconciliations, and spreadsheet-based reporting, which are time-consuming and prone to error, but there’s a push to digitize this work so back-office professionals can concentrate on strategic financial oversight. New AI products in this space (see Juniper Square’s Junie AI) will be ones to watch.
How Standard Metrics Can Help You With Fund Management
Standard Metrics is purpose-built to solve the pain points modern VC firms face, from streamlining manual workflows and reducing founder friction to enabling real-time insights, scalable reporting, and seamless data integrations. Our platform automates portfolio data collection, eliminates spreadsheet chaos, and provides a centralized source of truth that’s intuitive for both investors and founders. Whether you’re a first-time manager or a multi-fund institution, Standard Metrics delivers the operational infrastructure to future-proof your firm while improving investment decision-making and LP transparency.
With fast implementation, dedicated customer support, and AI-powered features like document parsing and KPI benchmarking, Standard Metrics helps VC teams focus on what matters: finding and supporting great companies. Our open, interoperable architecture integrates easily with the rest of your tech stack, and our ongoing product velocity ensures we evolve alongside your needs.
