Welcome to our inaugural quarterly benchmarking report!
We’re proud to support the financial reporting needs of over 100 VC firms and 8,000 portfolio companies at Standard Metrics. Our Global Benchmarking product delivers insights from aggregated and anonymized startup performance data to help investors and companies make better, forward-facing decisions. We’ll be sharing some of the most interesting benchmarking insights with our community each quarter.
Whether you’re preparing for a portfolio review, heading into a board meeting, or putting finishing touches on a forward-looking financial plan, fresh benchmarks will be at your fingertips with Standard Metrics.
The Latest Insights From Q3
We’re startup data nerds just like you, and we’ve dug into the last 12 quarters of benchmarking data to share interesting startup performance trends. Here are the four key highlights to share from last quarter.
1 — Top AI companies are now growing significantly faster than their non-AI counterparts.
- With eye-popping fundraising numbers, it’s clear that AI has captured the spotlight in the venture capital markets.
- We analyzed quarterly revenue growth rates of AI companies and found the upper-quartile growth rate benchmark strongly supports this enthusiasm.
- Q3 2024 showed a significant uptick in growth rates for early-stage AI startups in the $1–5M and $5–20M annualized revenue ranges. AI companies now outpace their peers in the broader innovation economy with 2X+ faster growth.
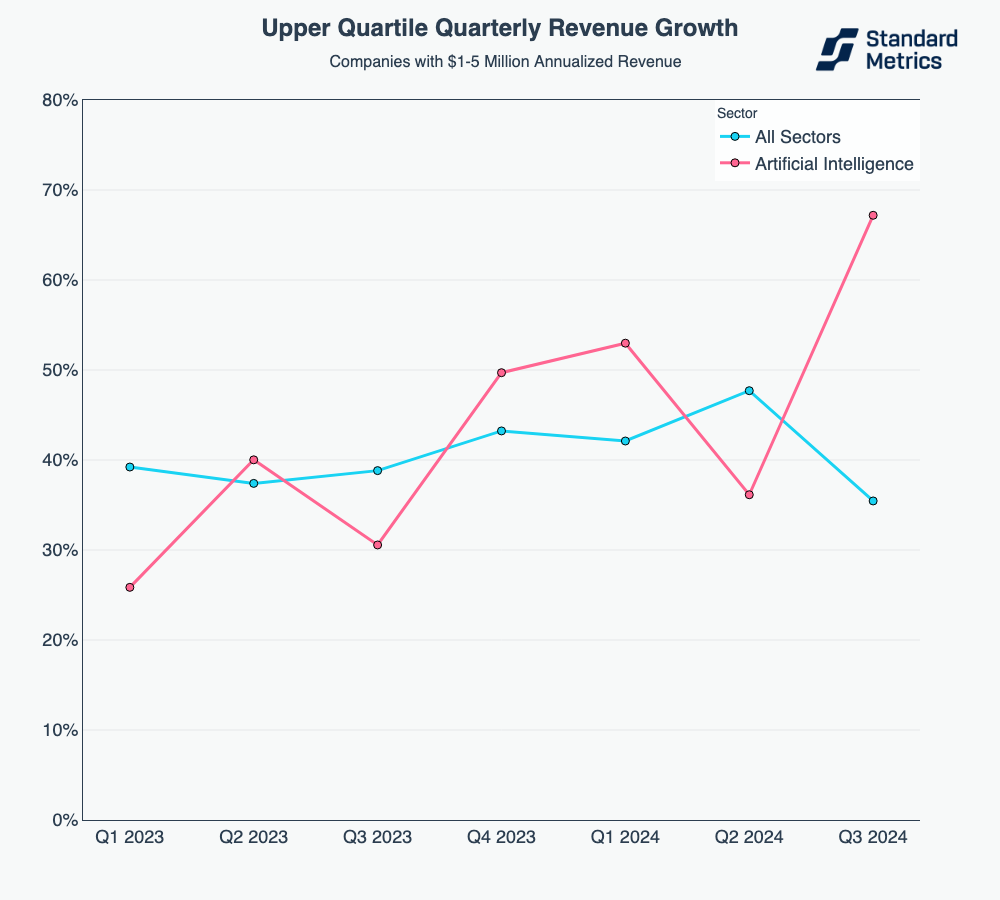
n = 50+ AI companies, 700+ companies from All Sectors
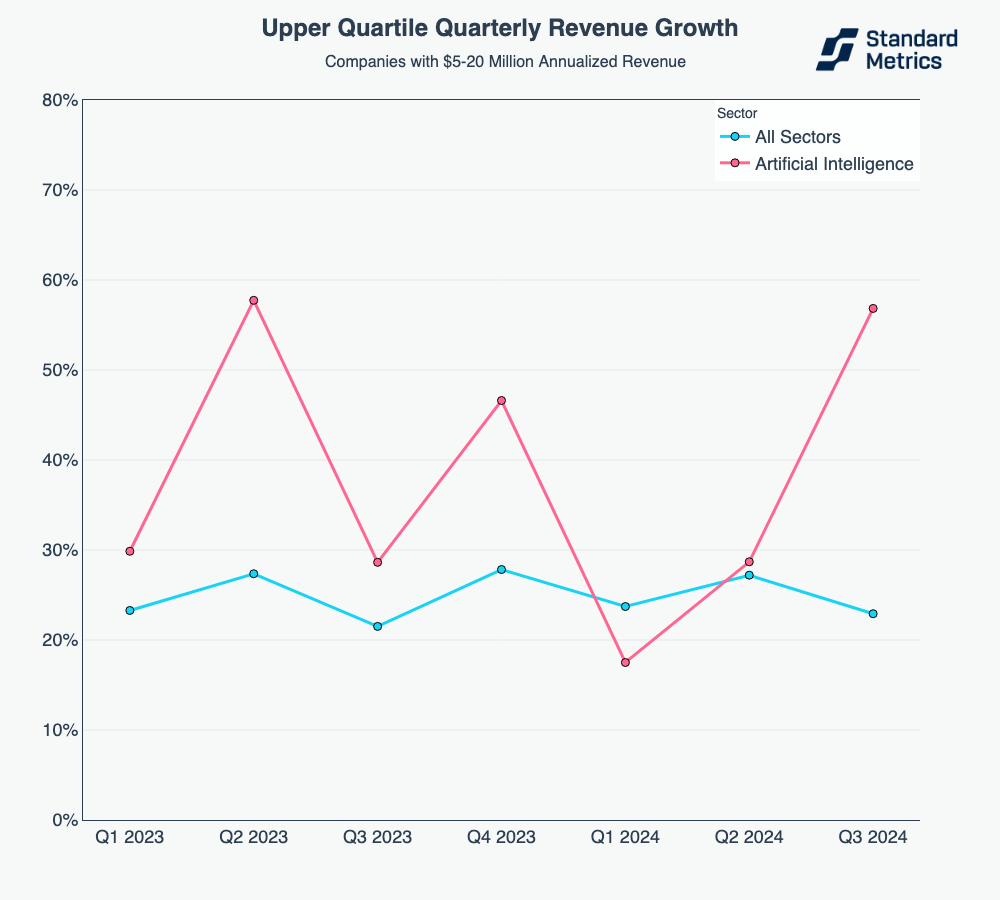
n = 40+ AI companies, 700+ companies from All Sectors
2 — Startups burn what they can, when they can
- Despite macroeconomic uncertainty over the last few years, startups continue to report similar aggregate runway levels over time.
- This consistency persists even as median burn and headcount have declined across revenue scales. When startups are flush with cash, they burn more. When markets cool down, startups significantly reduce burn to preserve runway.
- Since the fundraising peak of 2021, companies have seen cash balances decline across the board as spending has outpaced new funding rounds.
- Shrinking cash balances have driven companies to uniformly reduce their burn rates in a bid to preserve runway.
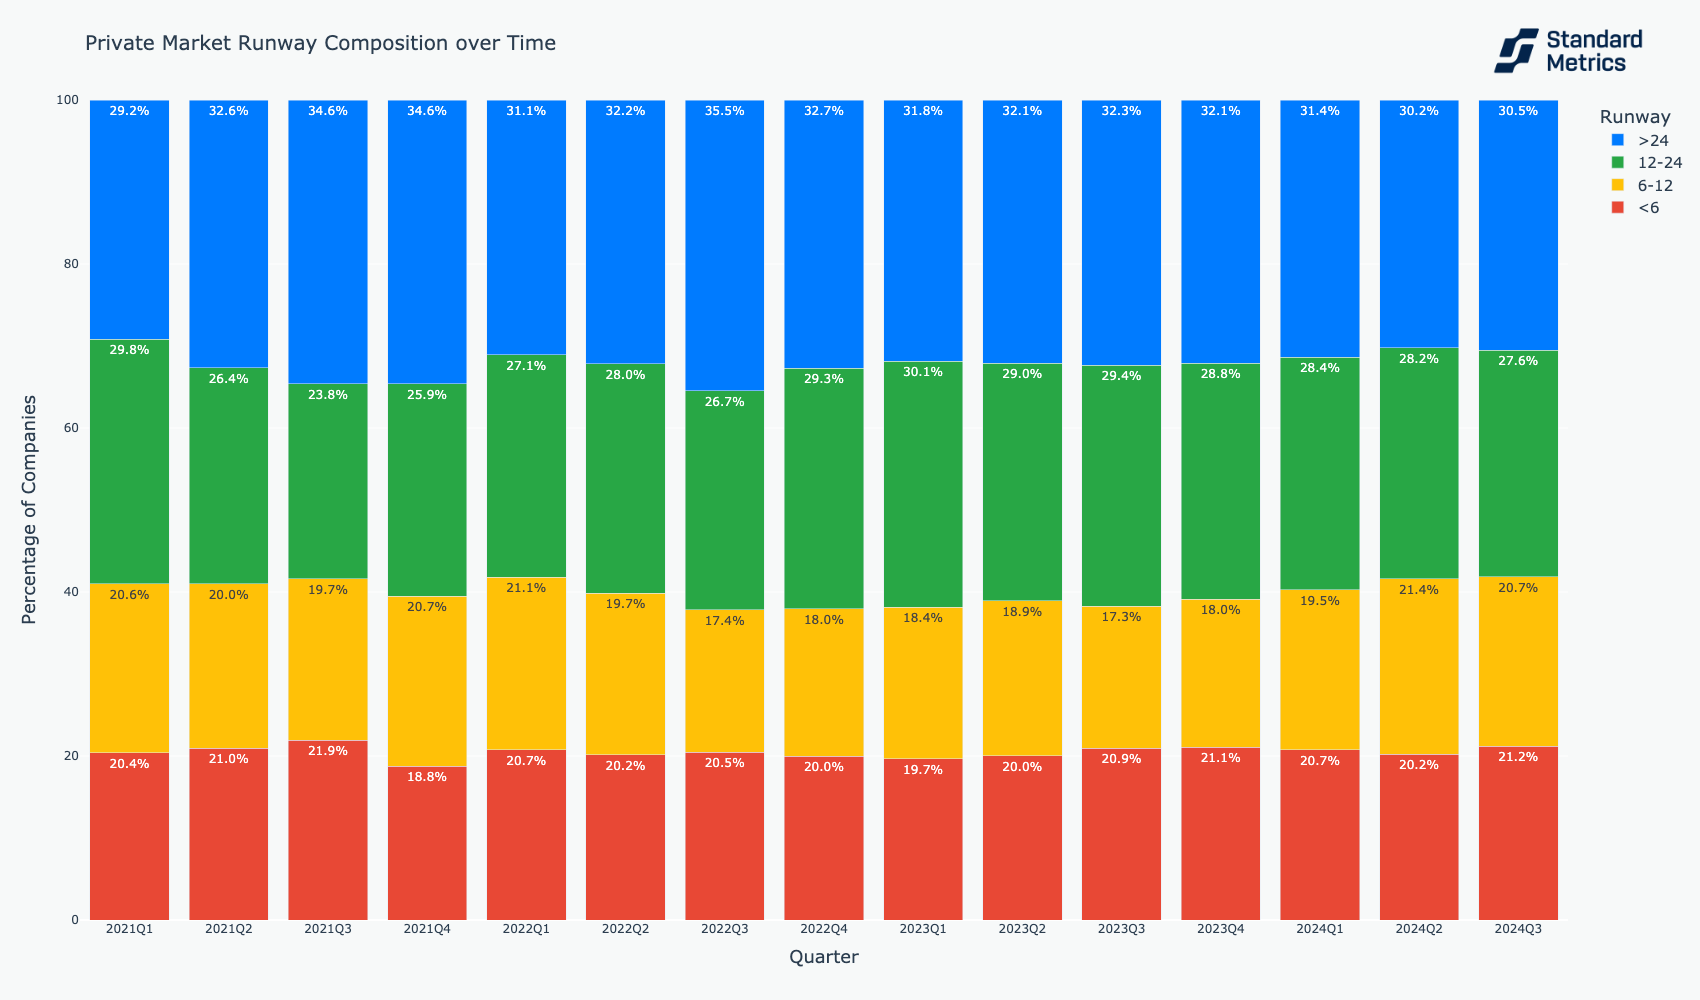
n = 2,500+ companies
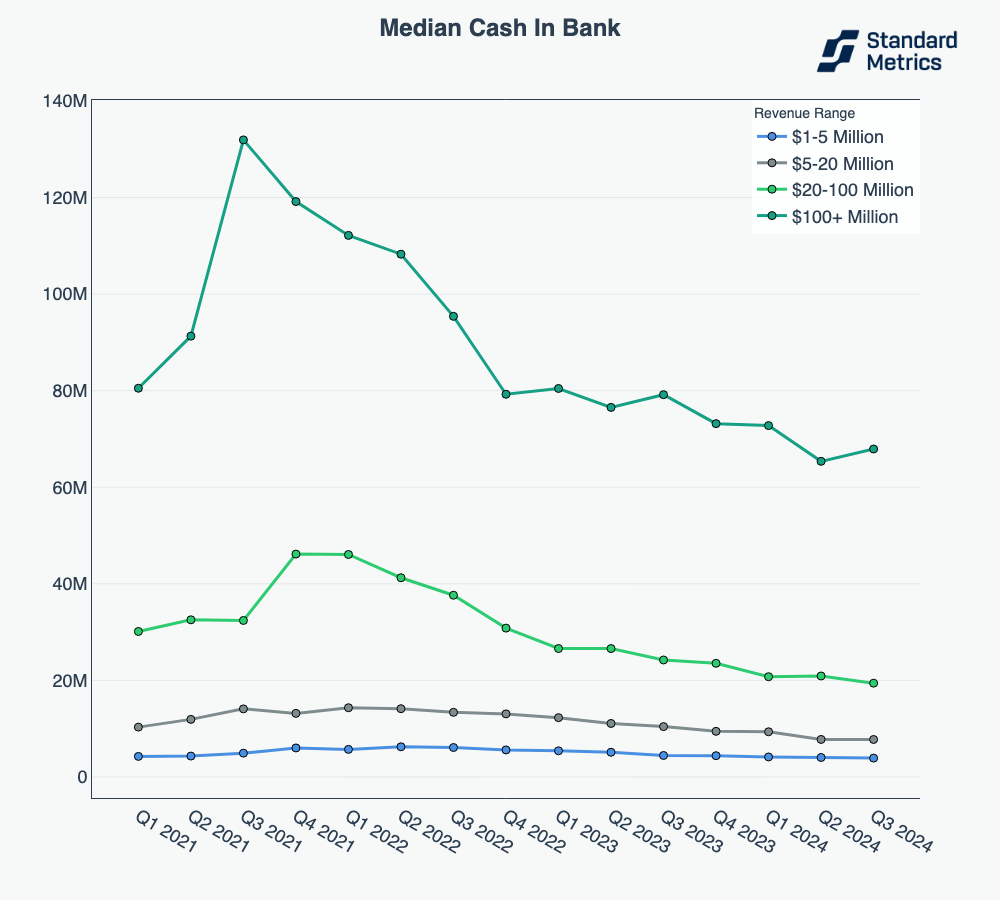
n = 2,000+ companies
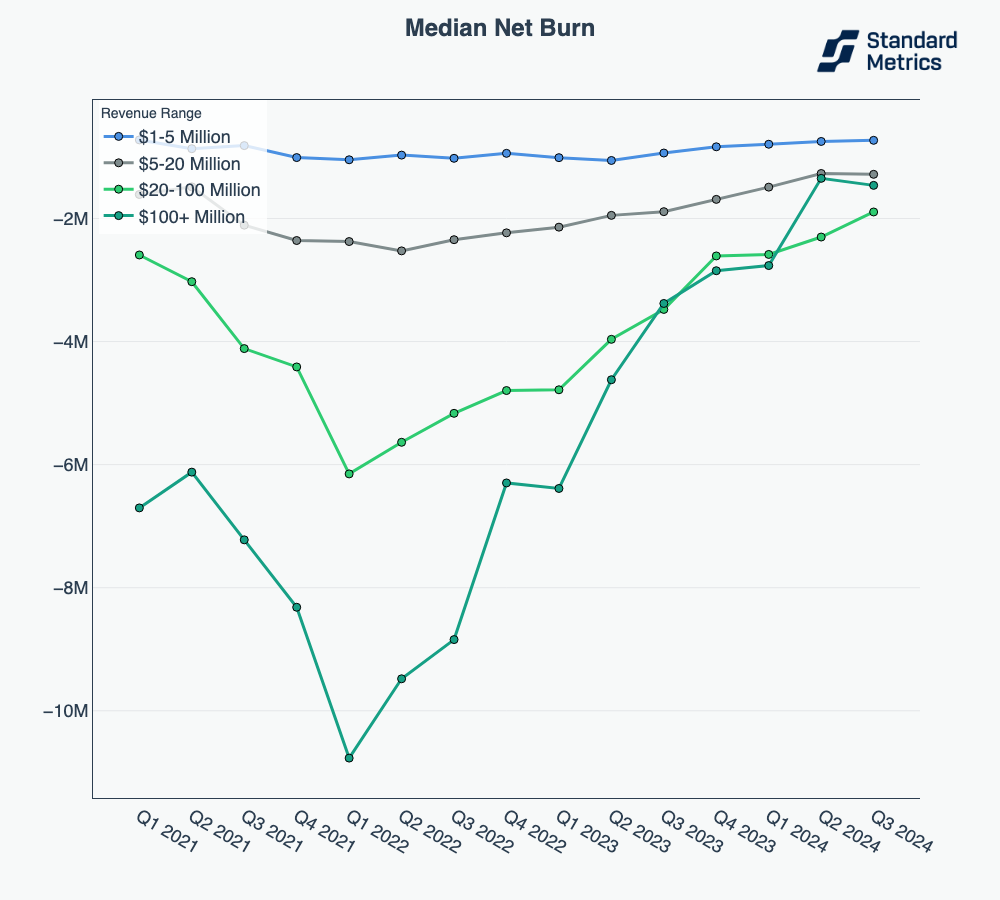
n = 2,000+ companies
3 — Later-stage companies are seeing hiring rebound while maintaining revenue per FTE efficiency
- For companies in the $20–100M and $100M+ annualized revenue brackets, median revenue growth has remained flat over the last 6 quarters.
- Those same later-stage companies are showing a change in their median headcount over the last two quarters; with an uptick off the bottom in H1 2024.
- This hiring trend highlights a continued focus on efficiency gains as the same later stage companies in both buckets steadily improve median revenue per FTE amidst the rise in headcount.
- The narrative is that AI is replacing jobs, but we’re not seeing it in our data yet.
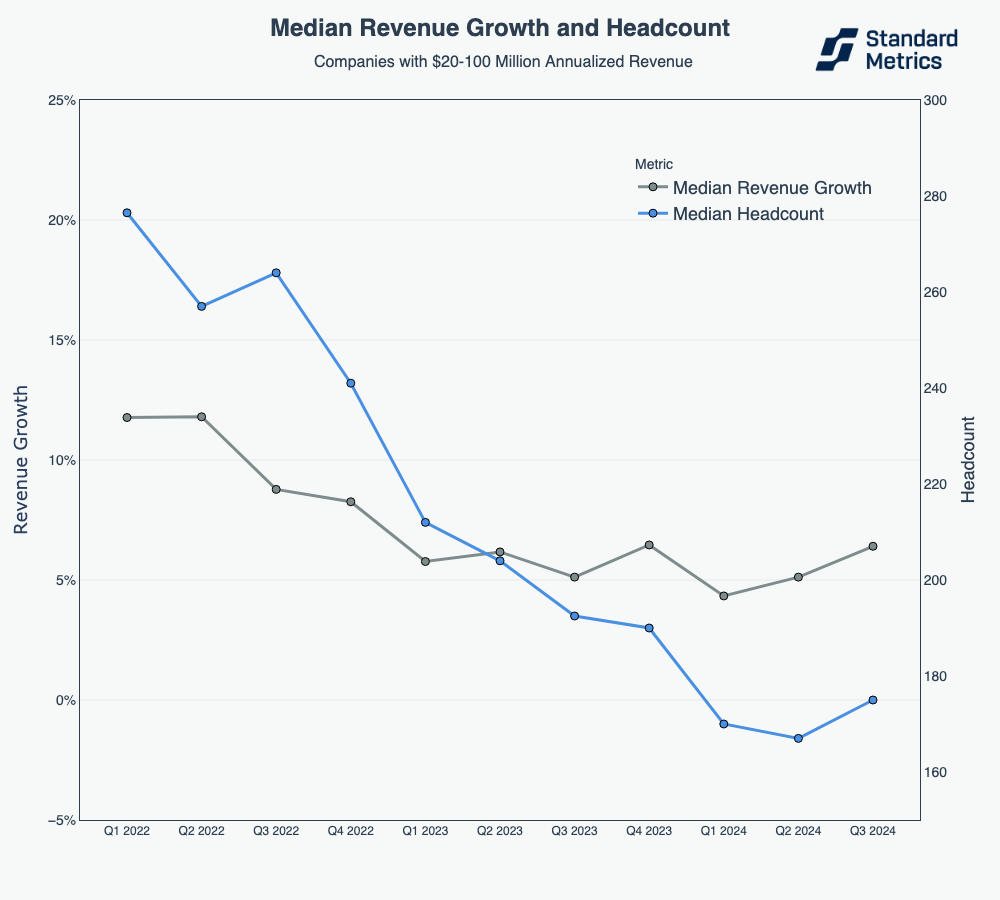
n = 300+ companies
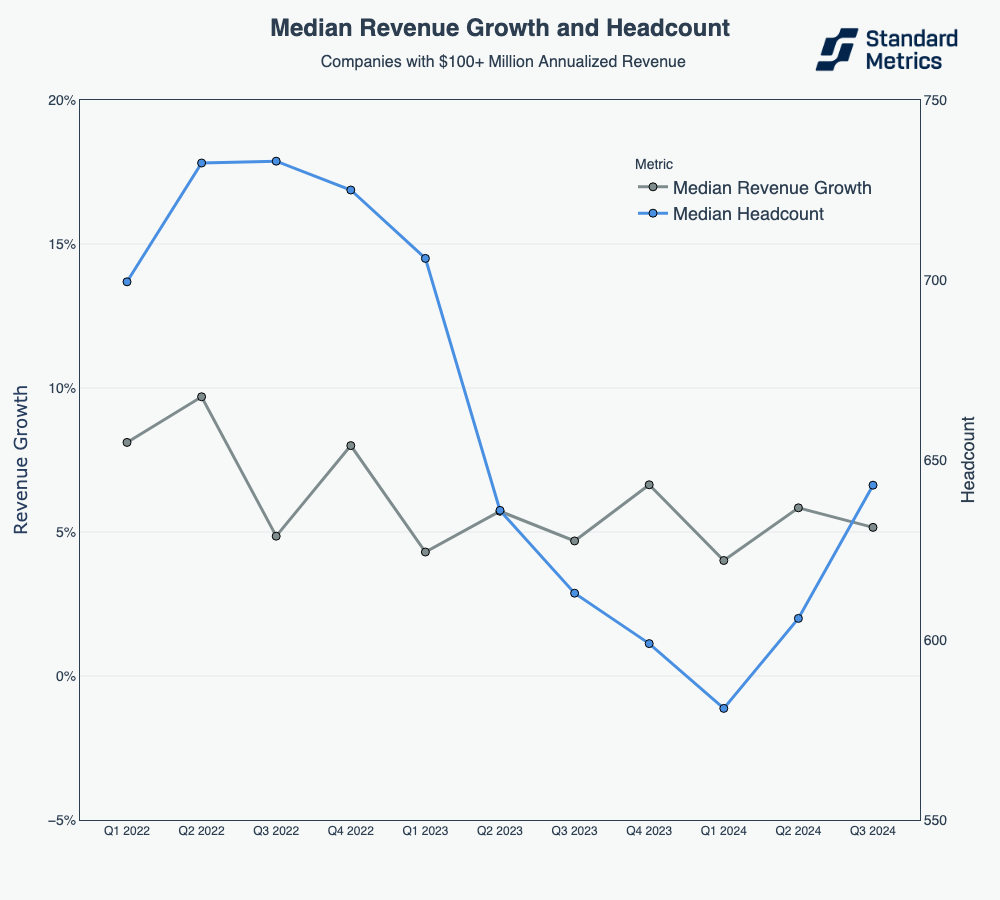
n = 100+ companies
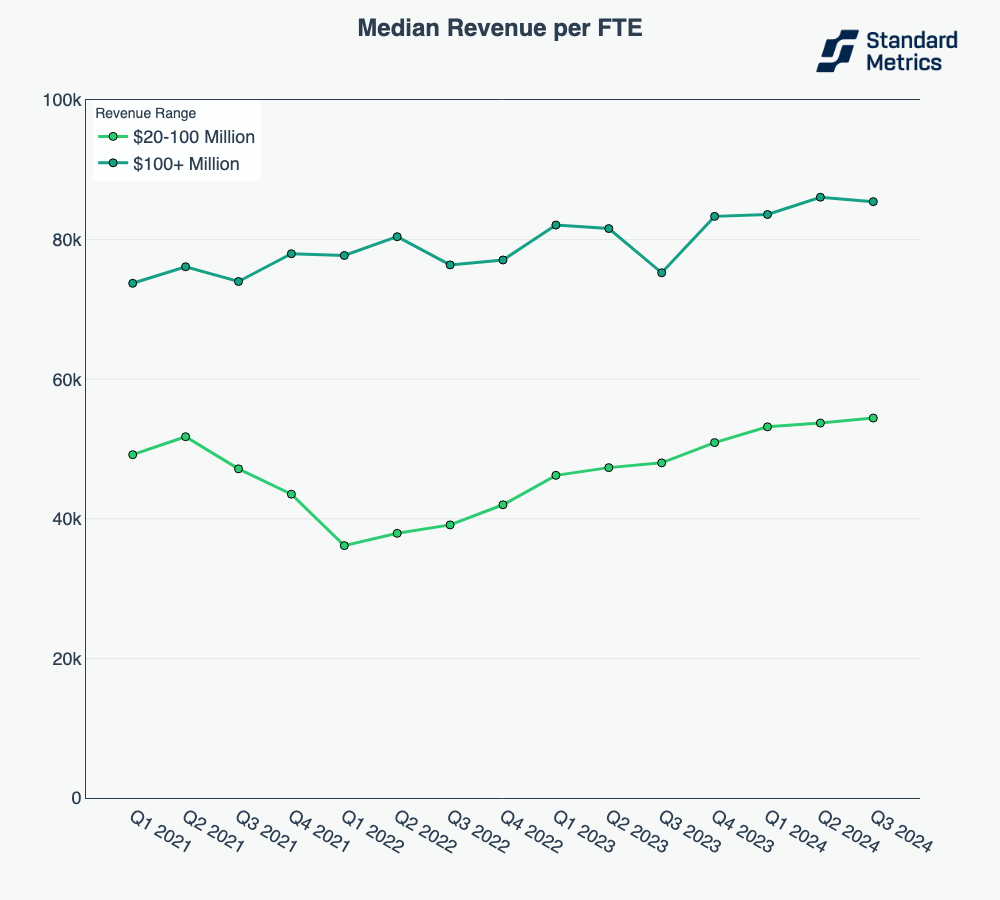
n = 200+ companies
4 — Early-stage companies continue to reduce headcount and focus on “lean growth”
- Q3 benchmarks reveal that companies between $1-5M and $5-20M in annualized revenue are continuing to decrease their headcount from 2022 peaks.
- Revenue growth rates spiked in Q2 for this cohort but came back down in Q3; growth rates have largely been flat since Q1 2023.
- These early companies are generating more revenue per FTE than they have historically as their teams have slimmed down.
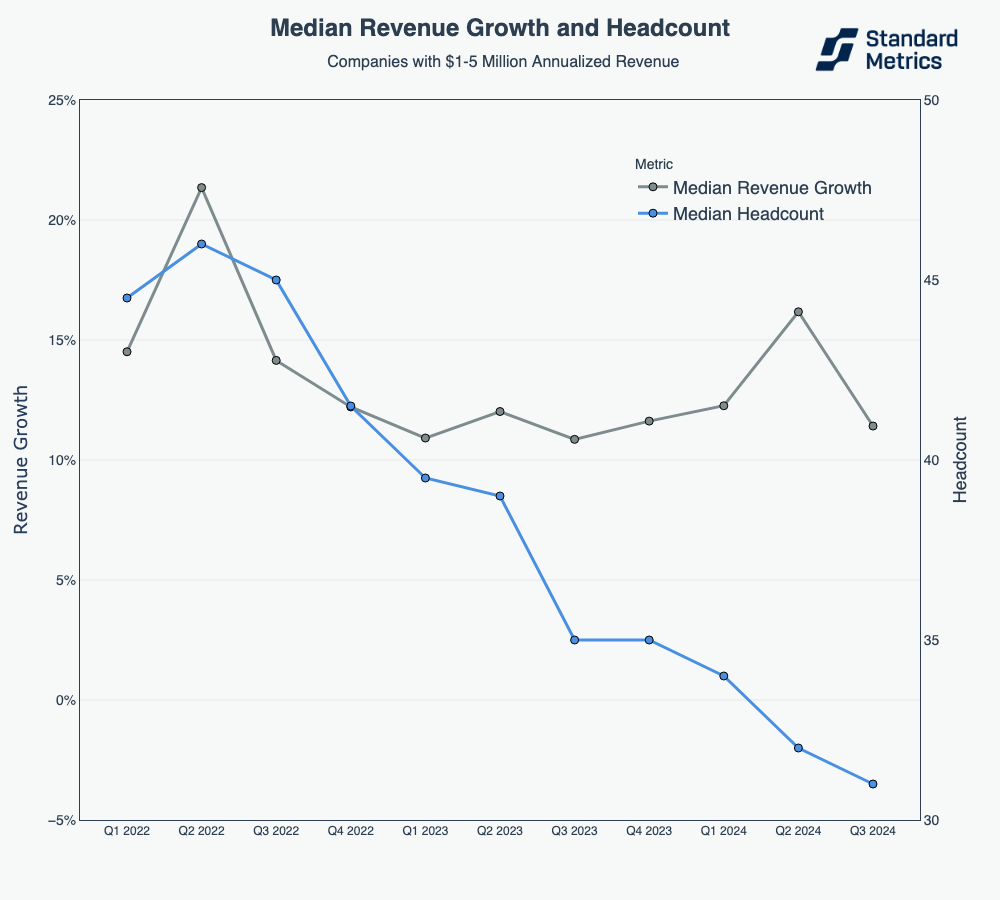
n = 500+ companies
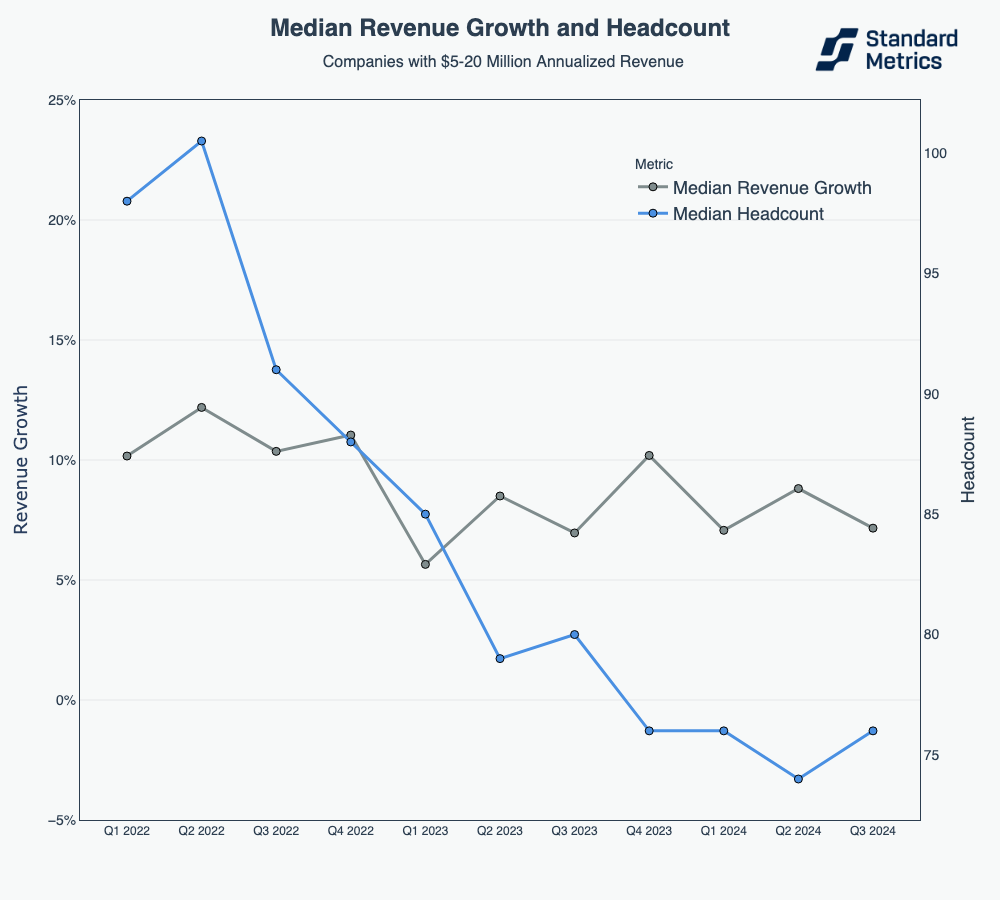
n = 500+ companies
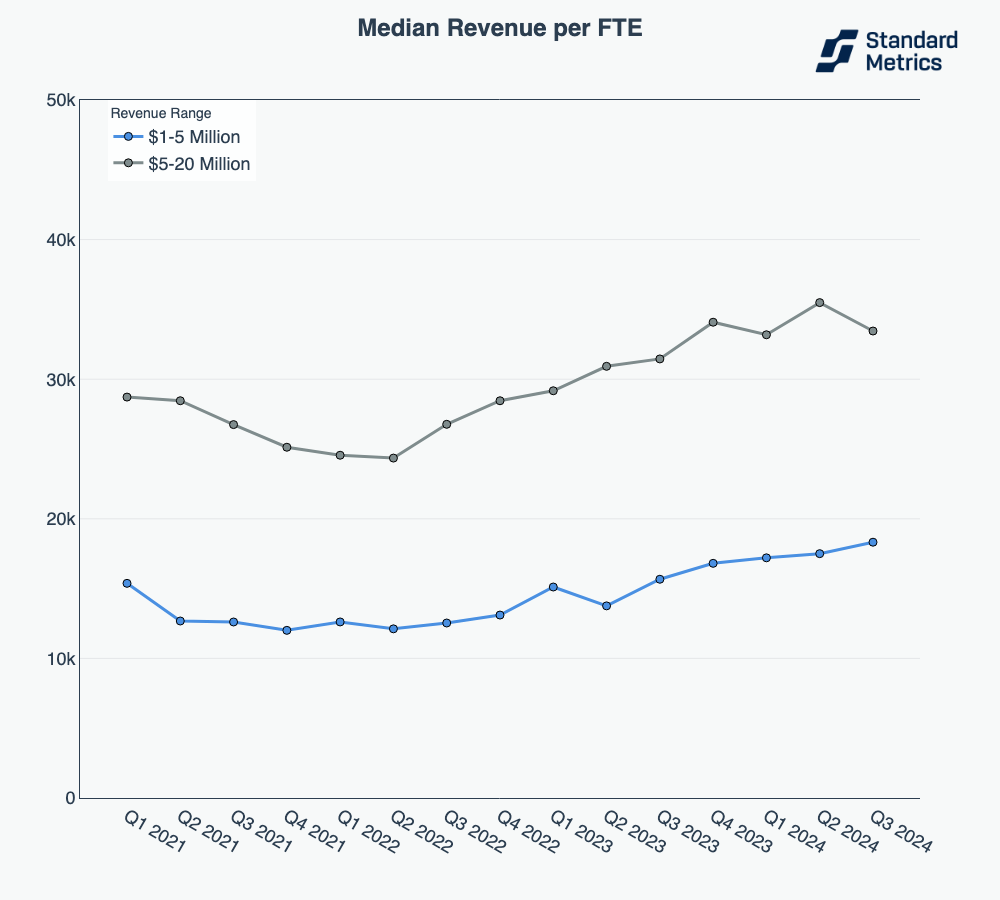
n = 500+ companies
In Case You Missed It
We launched our Global Benchmarking product publicly in September, and 8VC — a long-time partner of Standard Metrics — published a case study on the insights they gained from this tool. Read the case study here.
Thanks for reading, and please reach out if there are any particular topics you’d like for us to cover in the future!
– Ethan Finkel and Nathan Kapjian-Pitt, with special thanks to Jackson Gress
Methodology
- What we display for “N”:
- For graphs that represent multiple cohorts of companies (e.g. “Median Revenue per FTE” chart above), N is the total number of companies across all cohorts in the most recent period (e.g. “Q3 2024”).
- For graphs analyzing a single cohort (e.g. “Median Revenue Growth and Headcount over Time, Companies with $1-5 Million Annualized Revenue”), N is the number of companies in the most recent period in the chart.
- If there are two metrics being benchmarked on the same chart (e.g. headcount and revenue growth), we display the lower N.
- We do not display benchmarks with N < 30.
- Annualized revenue bins:
- Companies are included in an annualized revenue bin based on their annualized revenue value calculated in each respective quarterly period.
- Sector:
- Companies self-identify their sector at time of onboarding onto our platform and can update their sector at any time afterwards.
- Company data:
- Companies are in control of their data on Standard Metrics. They are notified about our benchmarking product during onboarding and can get access to benchmarking insights on our platform. They can opt out of their data being included in benchmarking anytime.
- Only companies who have completed onboarding onto Standard Metrics are eligible for inclusion in our benchmarking dataset.
Automate your portfolio reporting
Find out how you can:
- Collect a higher volume of accurate data
- Analyze a robust, auditable data set
- Deliver insights that drive fund performance
