
We are excited to release our Q2 2025 startup benchmarking report, highlighting the most interesting stories from the quarter in the private markets. The reports are built from our Global Benchmarking data, an anonymized set of financial metrics from over 9,000 venture-backed startups on Standard Metrics.
In Q2 2025, we focus in on AI startups, calling early stage AI startups with $1-20M in annualized revenue at the quarter end Rocks and AI startups with $20M+ in annualized revenue at the quarter end Boulders.
Some highlights found in the report:
- Upper quartile AI Rocks have outpaced all sectors by roughly 10 to 30 percentage points in quarterly revenue growth since late 2023, but lag in revenue per FTE efficiency.
- Upper quartile AI Boulders consistently outpace upper quartile companies across all sectors in quarterly revenue growth (around 10 to 20 percentage points higher each quarter). In Q2 2025, they pair that growth with remarkable progress in revenue per FTE efficiency.
- Upper quartile AI Boulders outpace fintech and SaaS in revenue growth in 2025, while top-quartile fintech wins out in profitability and low burn.
Check out the data, the details, and more of our findings below.
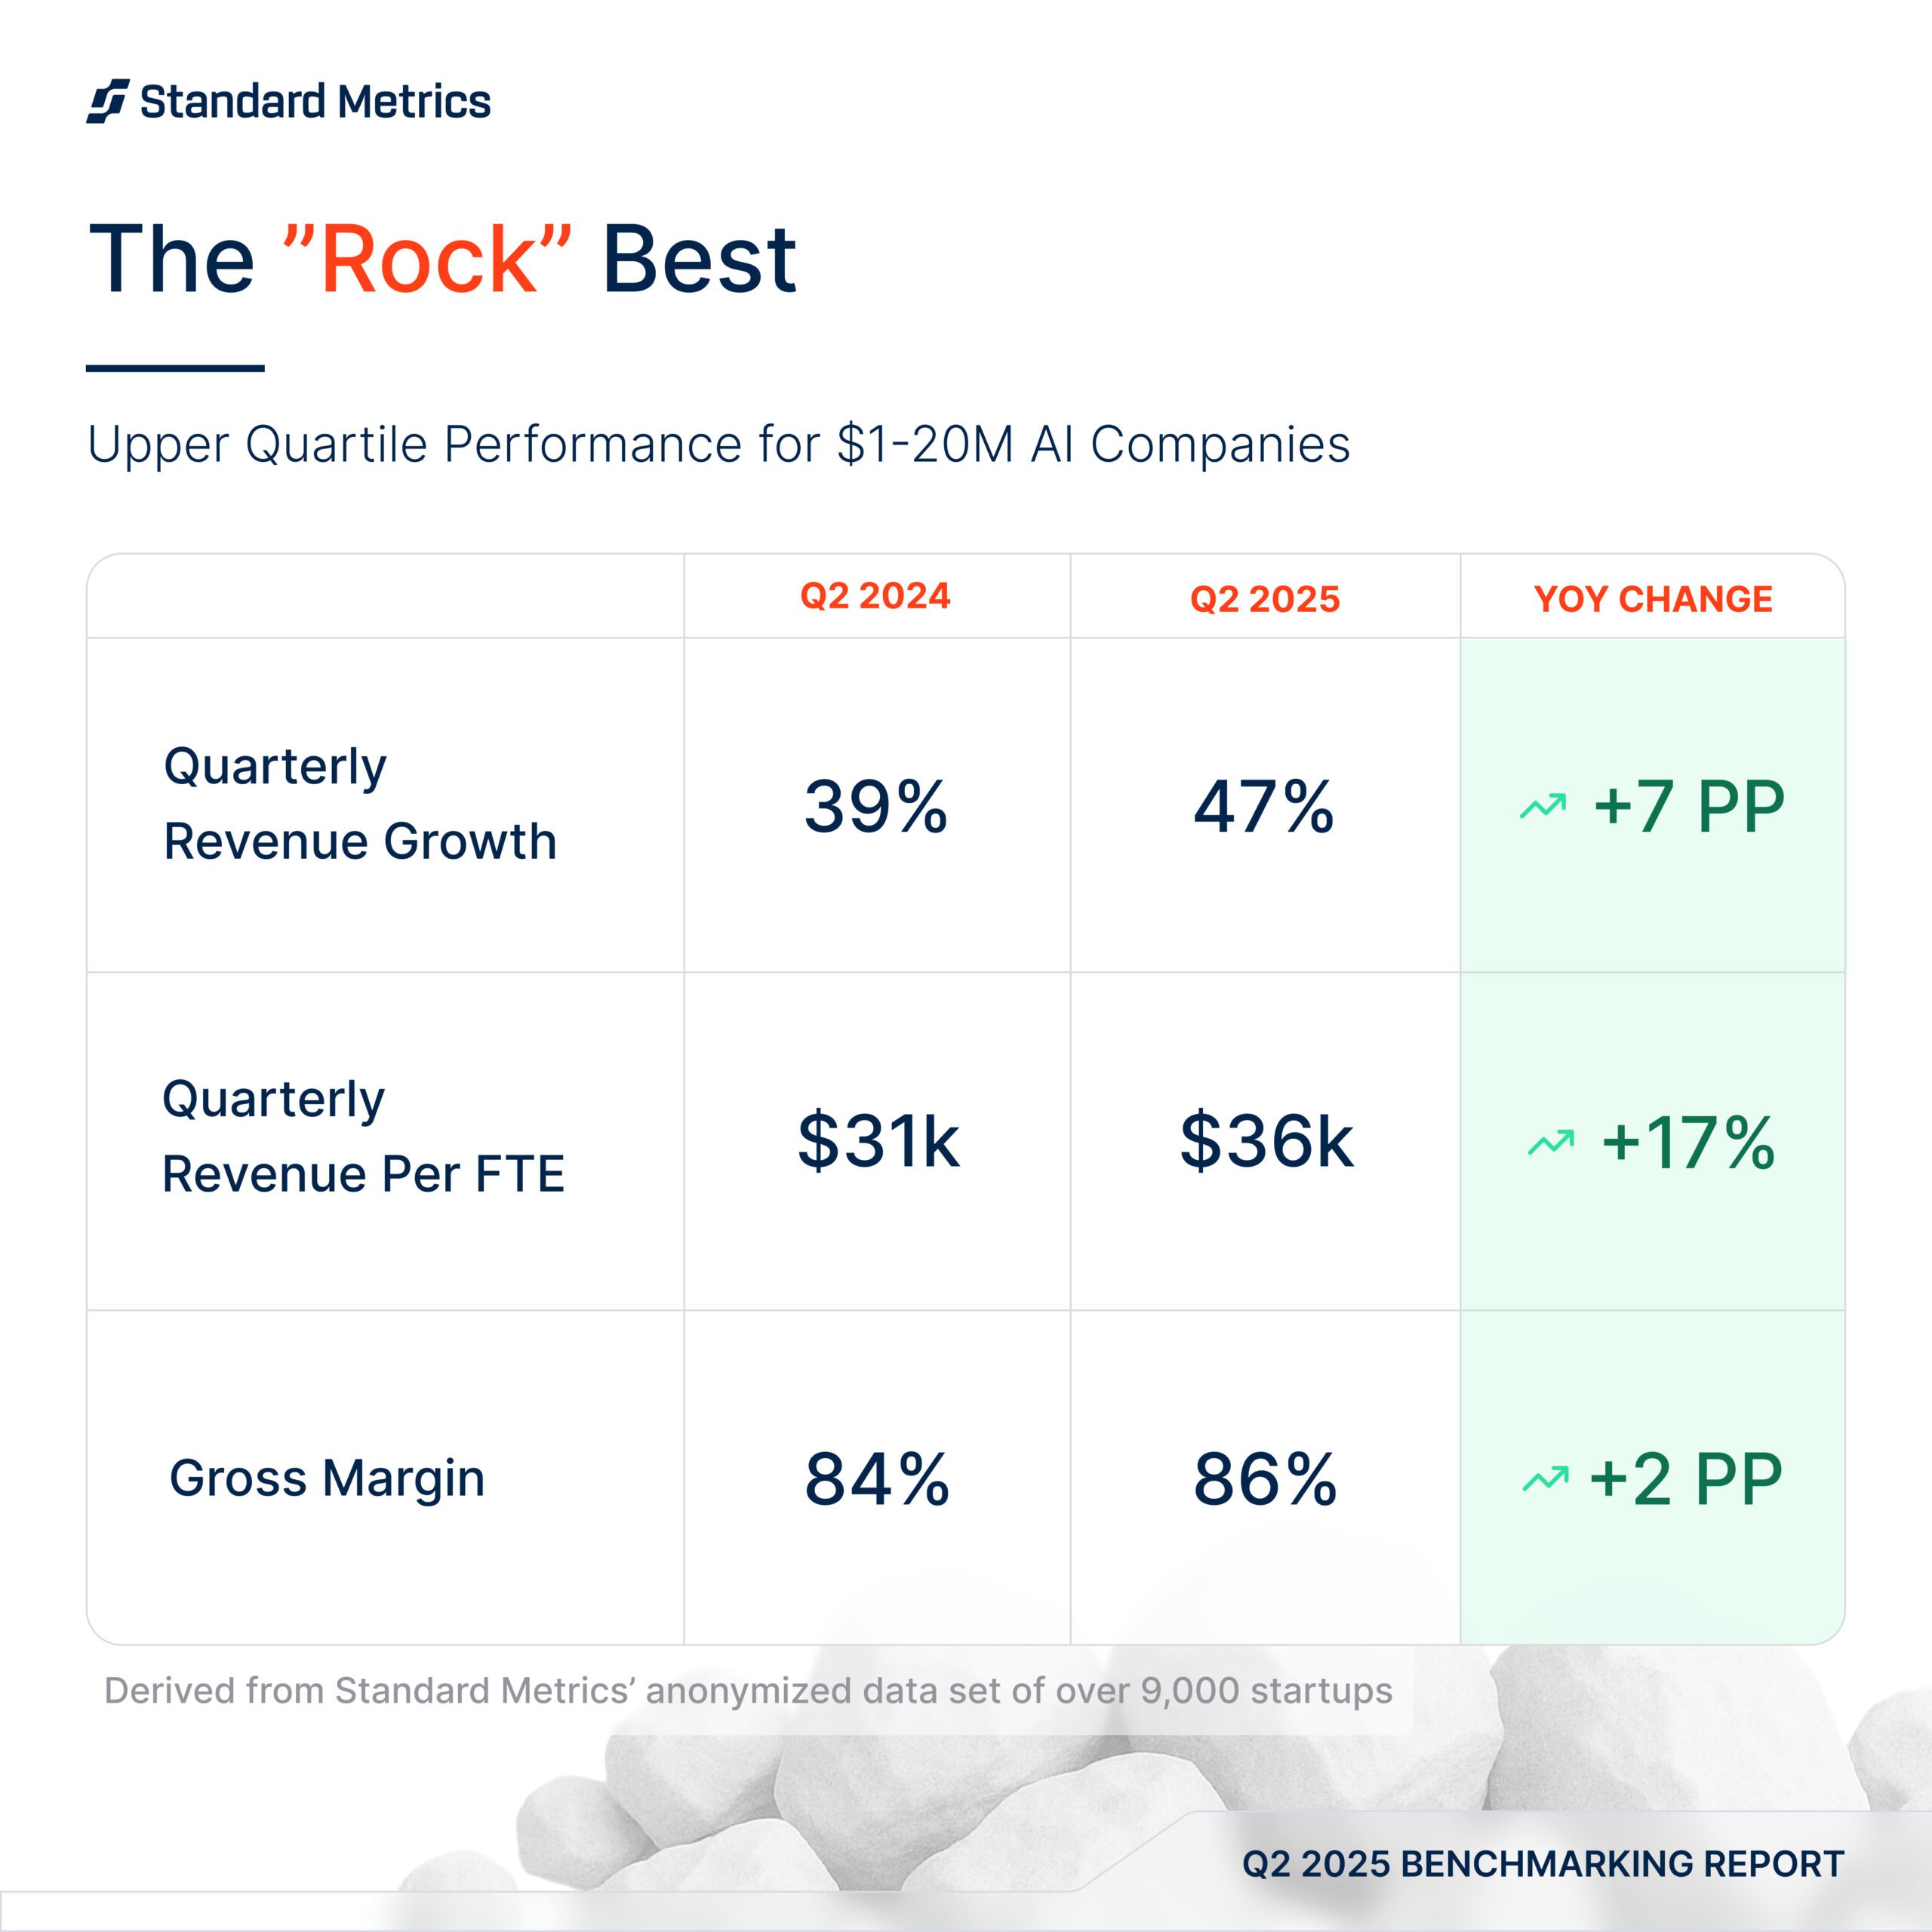
AI Rocks ($1-20M in annualized revenue): A push towards operational efficiency
Note: This section was refreshed on 12/4/25 following a review of the underlying calculations.
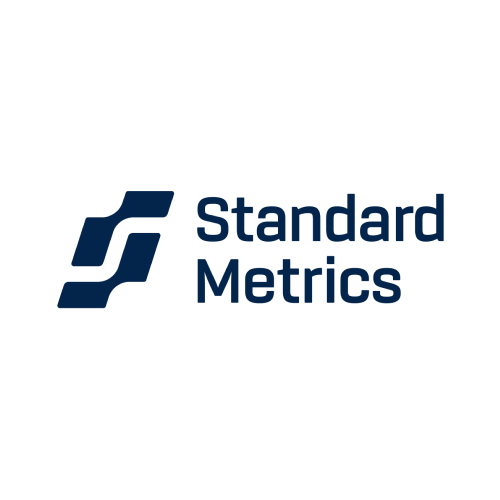
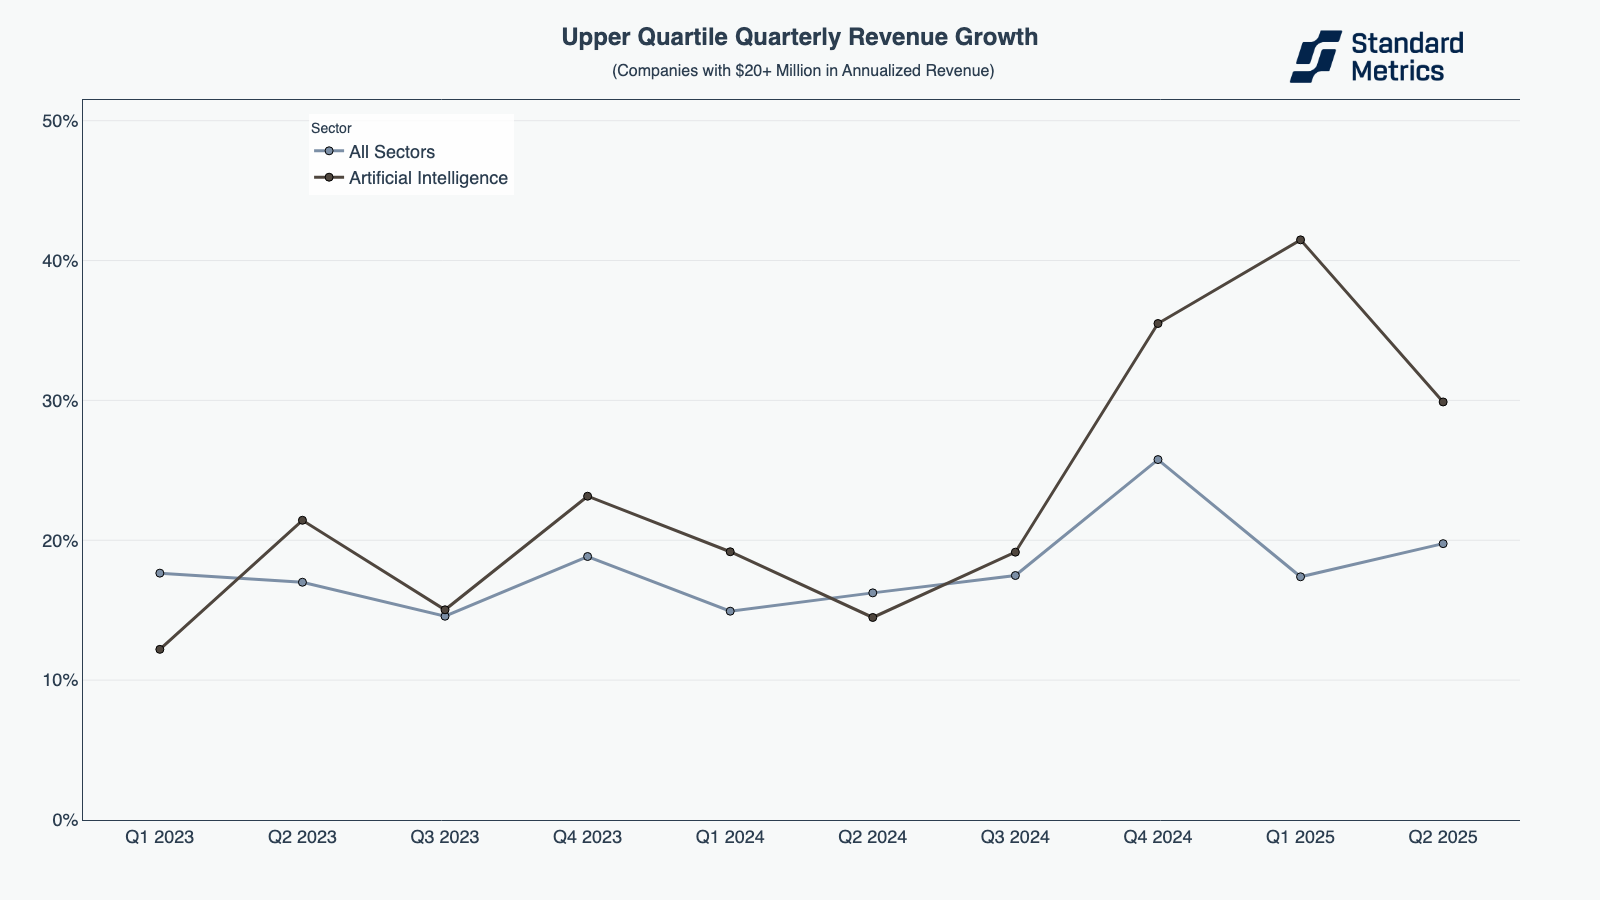
In terms of quarterly revenue growth, upper quartile AI Rocks (AI startups with $1-20M in annualized revenue) have outpaced the all sector average since Q4 2023. While revenue growth has moderated from the extraordinary peaks of late 2024, these AI companies are still growing far faster than all sectors (an 11 percentage point difference in Q2 2025), underscoring ongoing strong demand.
N=160
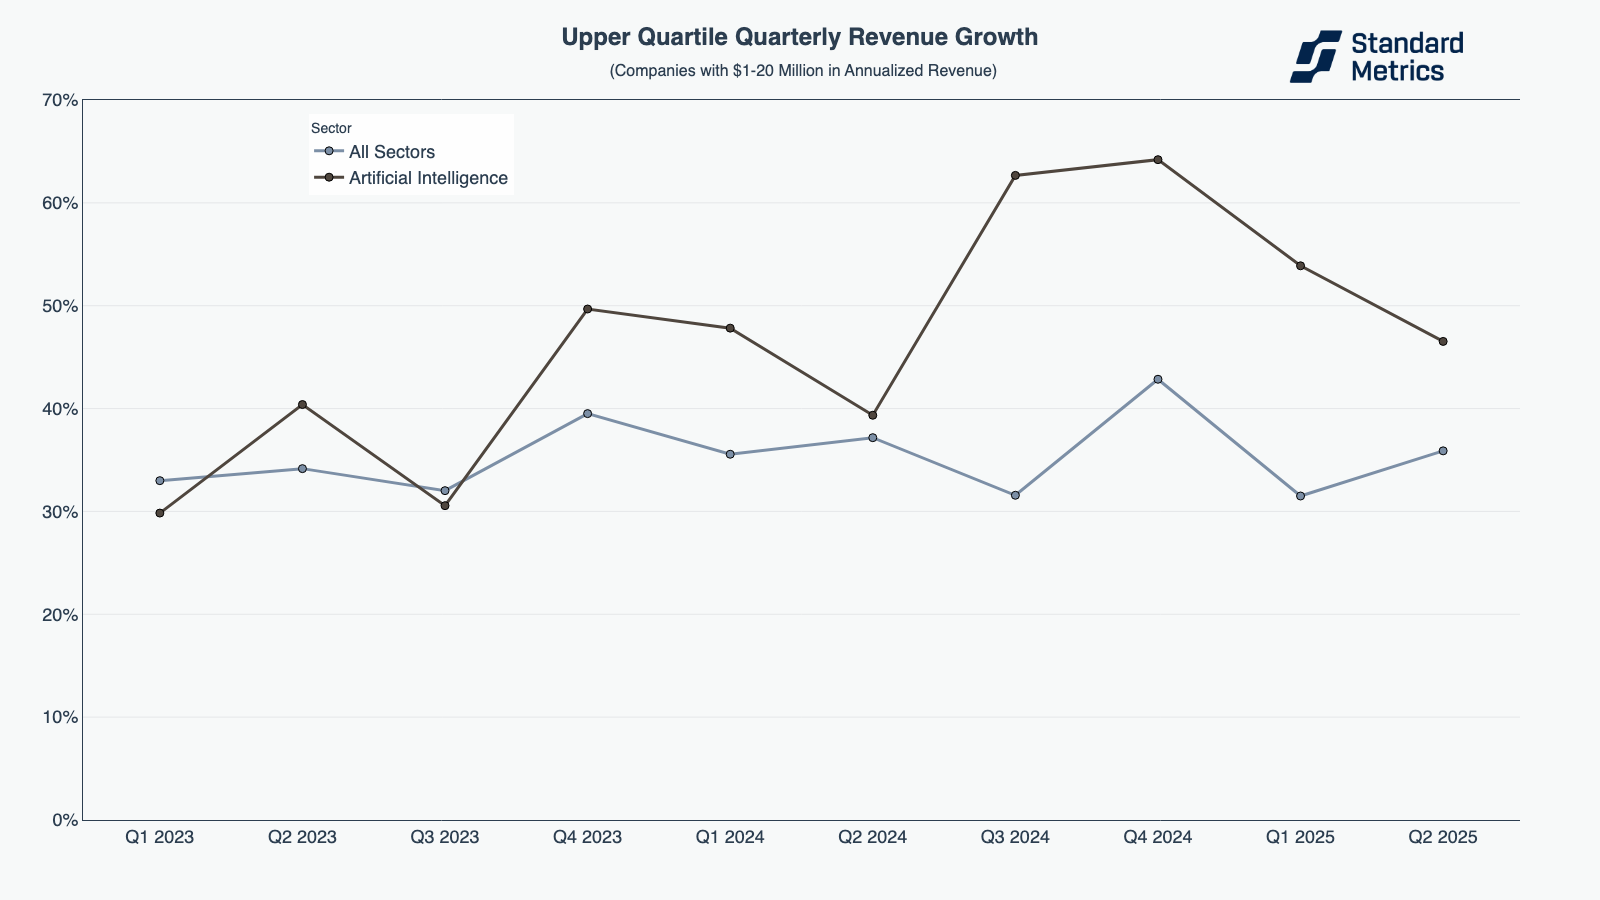
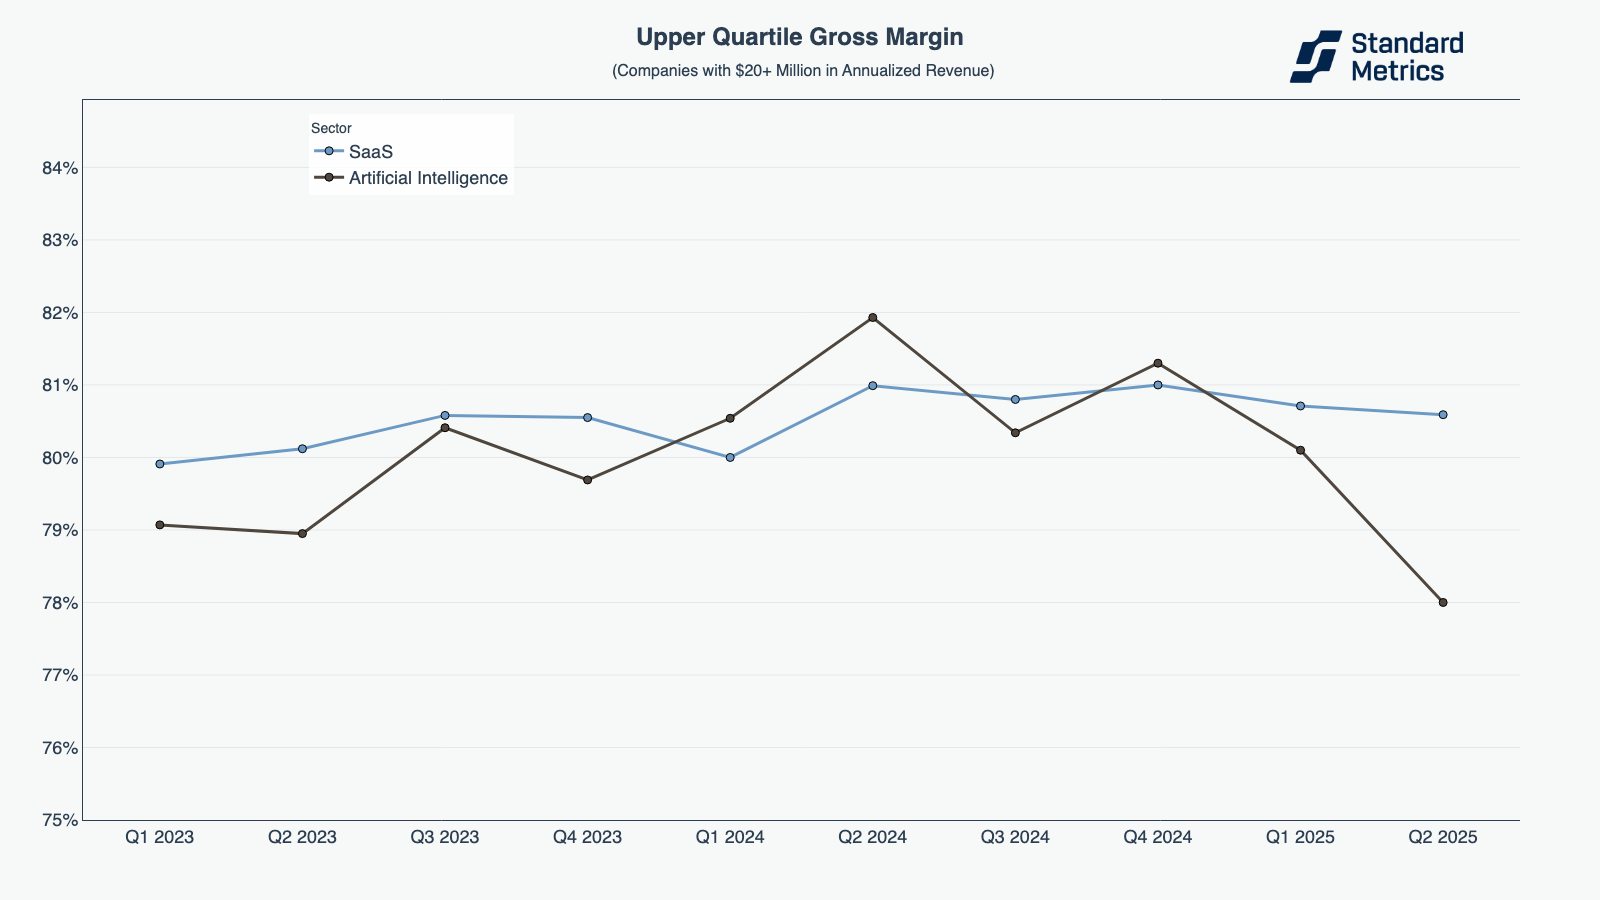
Upper quartile AI Rocks also maintain relatively high gross margins (84-91%). In this analysis we focused on AI vs. SaaS (instead of all sectors) as we wanted more comparable one-to-one analysis in the software space. In the past, early stage, upper quartile AI and SaaS companies followed relatively similar patterns, peaking and falling at similar times, but with the AI cohort .5 to 5 percentage points higher than SaaS. In Q2 2025 (as we saw in Q2 2024), however, AI had slightly lower gross margins than SaaS.
N=153
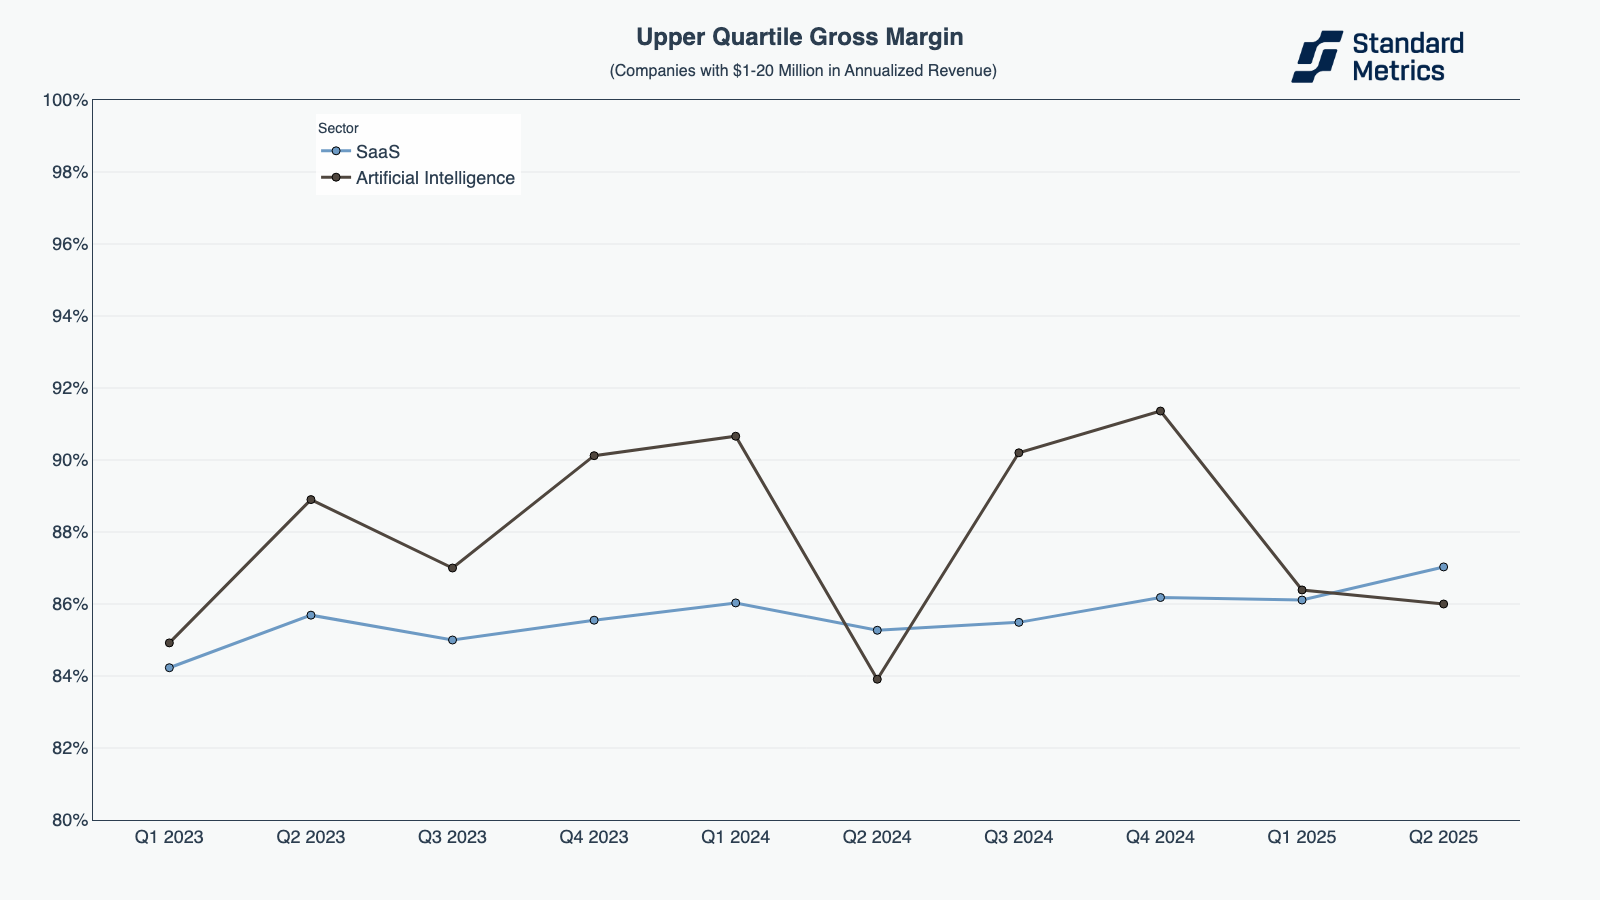
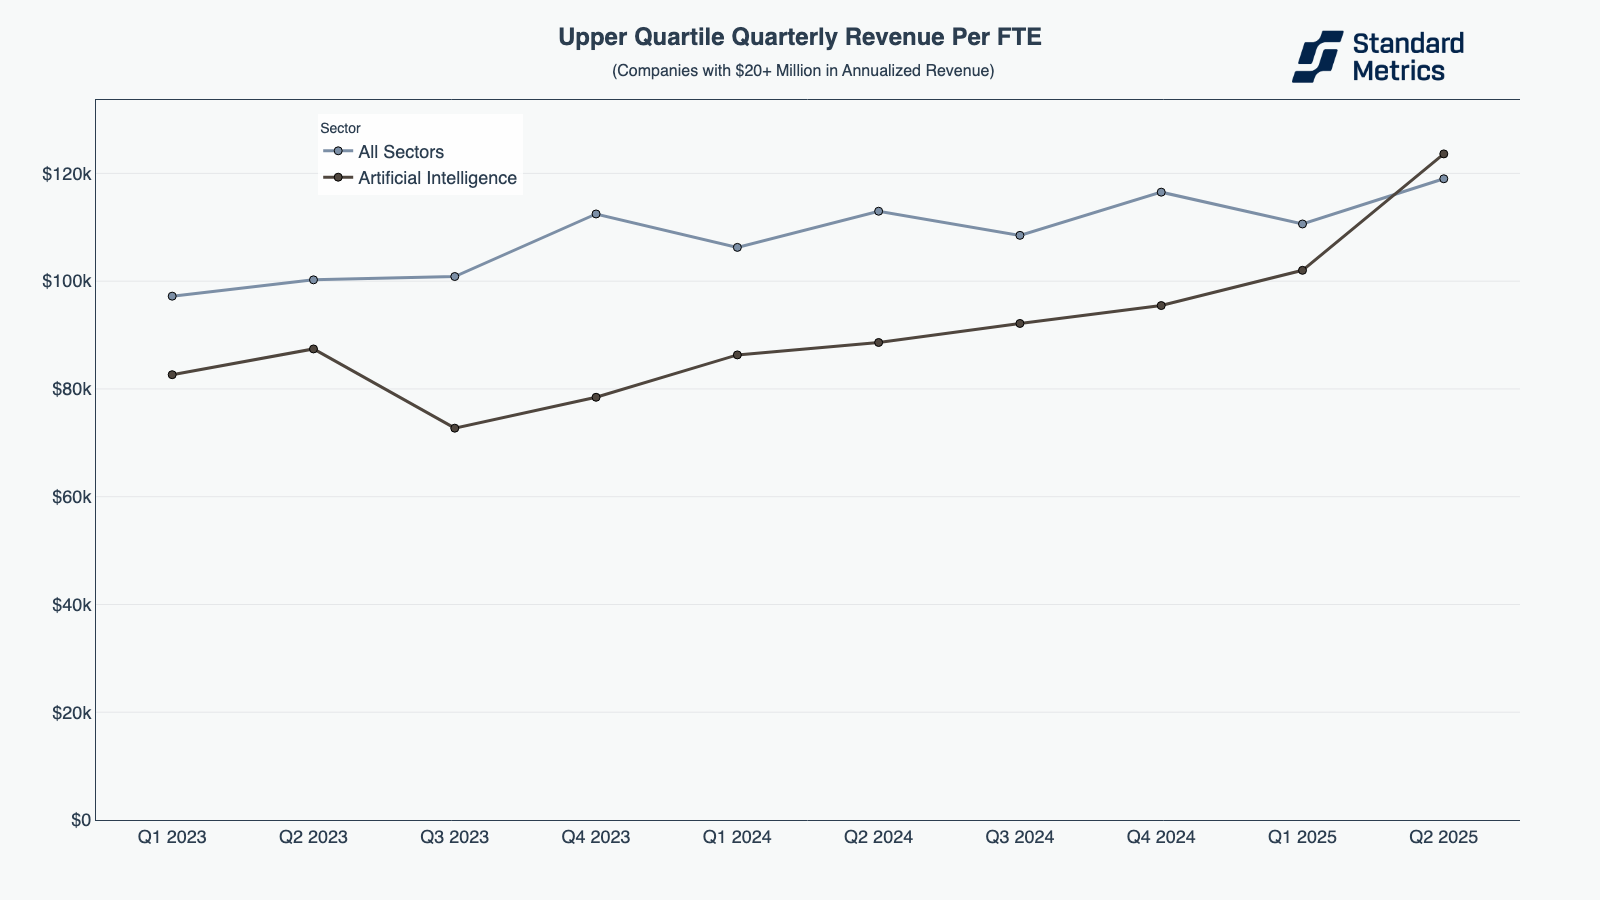
However, upper quartile AI Rocks lag in revenue per FTE efficiency. All sectors, meanwhile, steadily improved efficiency, reflecting a trend (that we discussed in our previous benchmarking report) of scaling operations with controlled headcount growth.
This perhaps highlights that upper quartile, early stage AI companies have been hiring aggressively, potentially ahead of revenue, as they race to capture market share during the growth surge.
N=126
With moderately high margins, relatively strong growth, and increasing operational discipline, early-stage, upper quartile AI remains one of the most attractive sectors for long-term investment, poised to produce outsized returns.
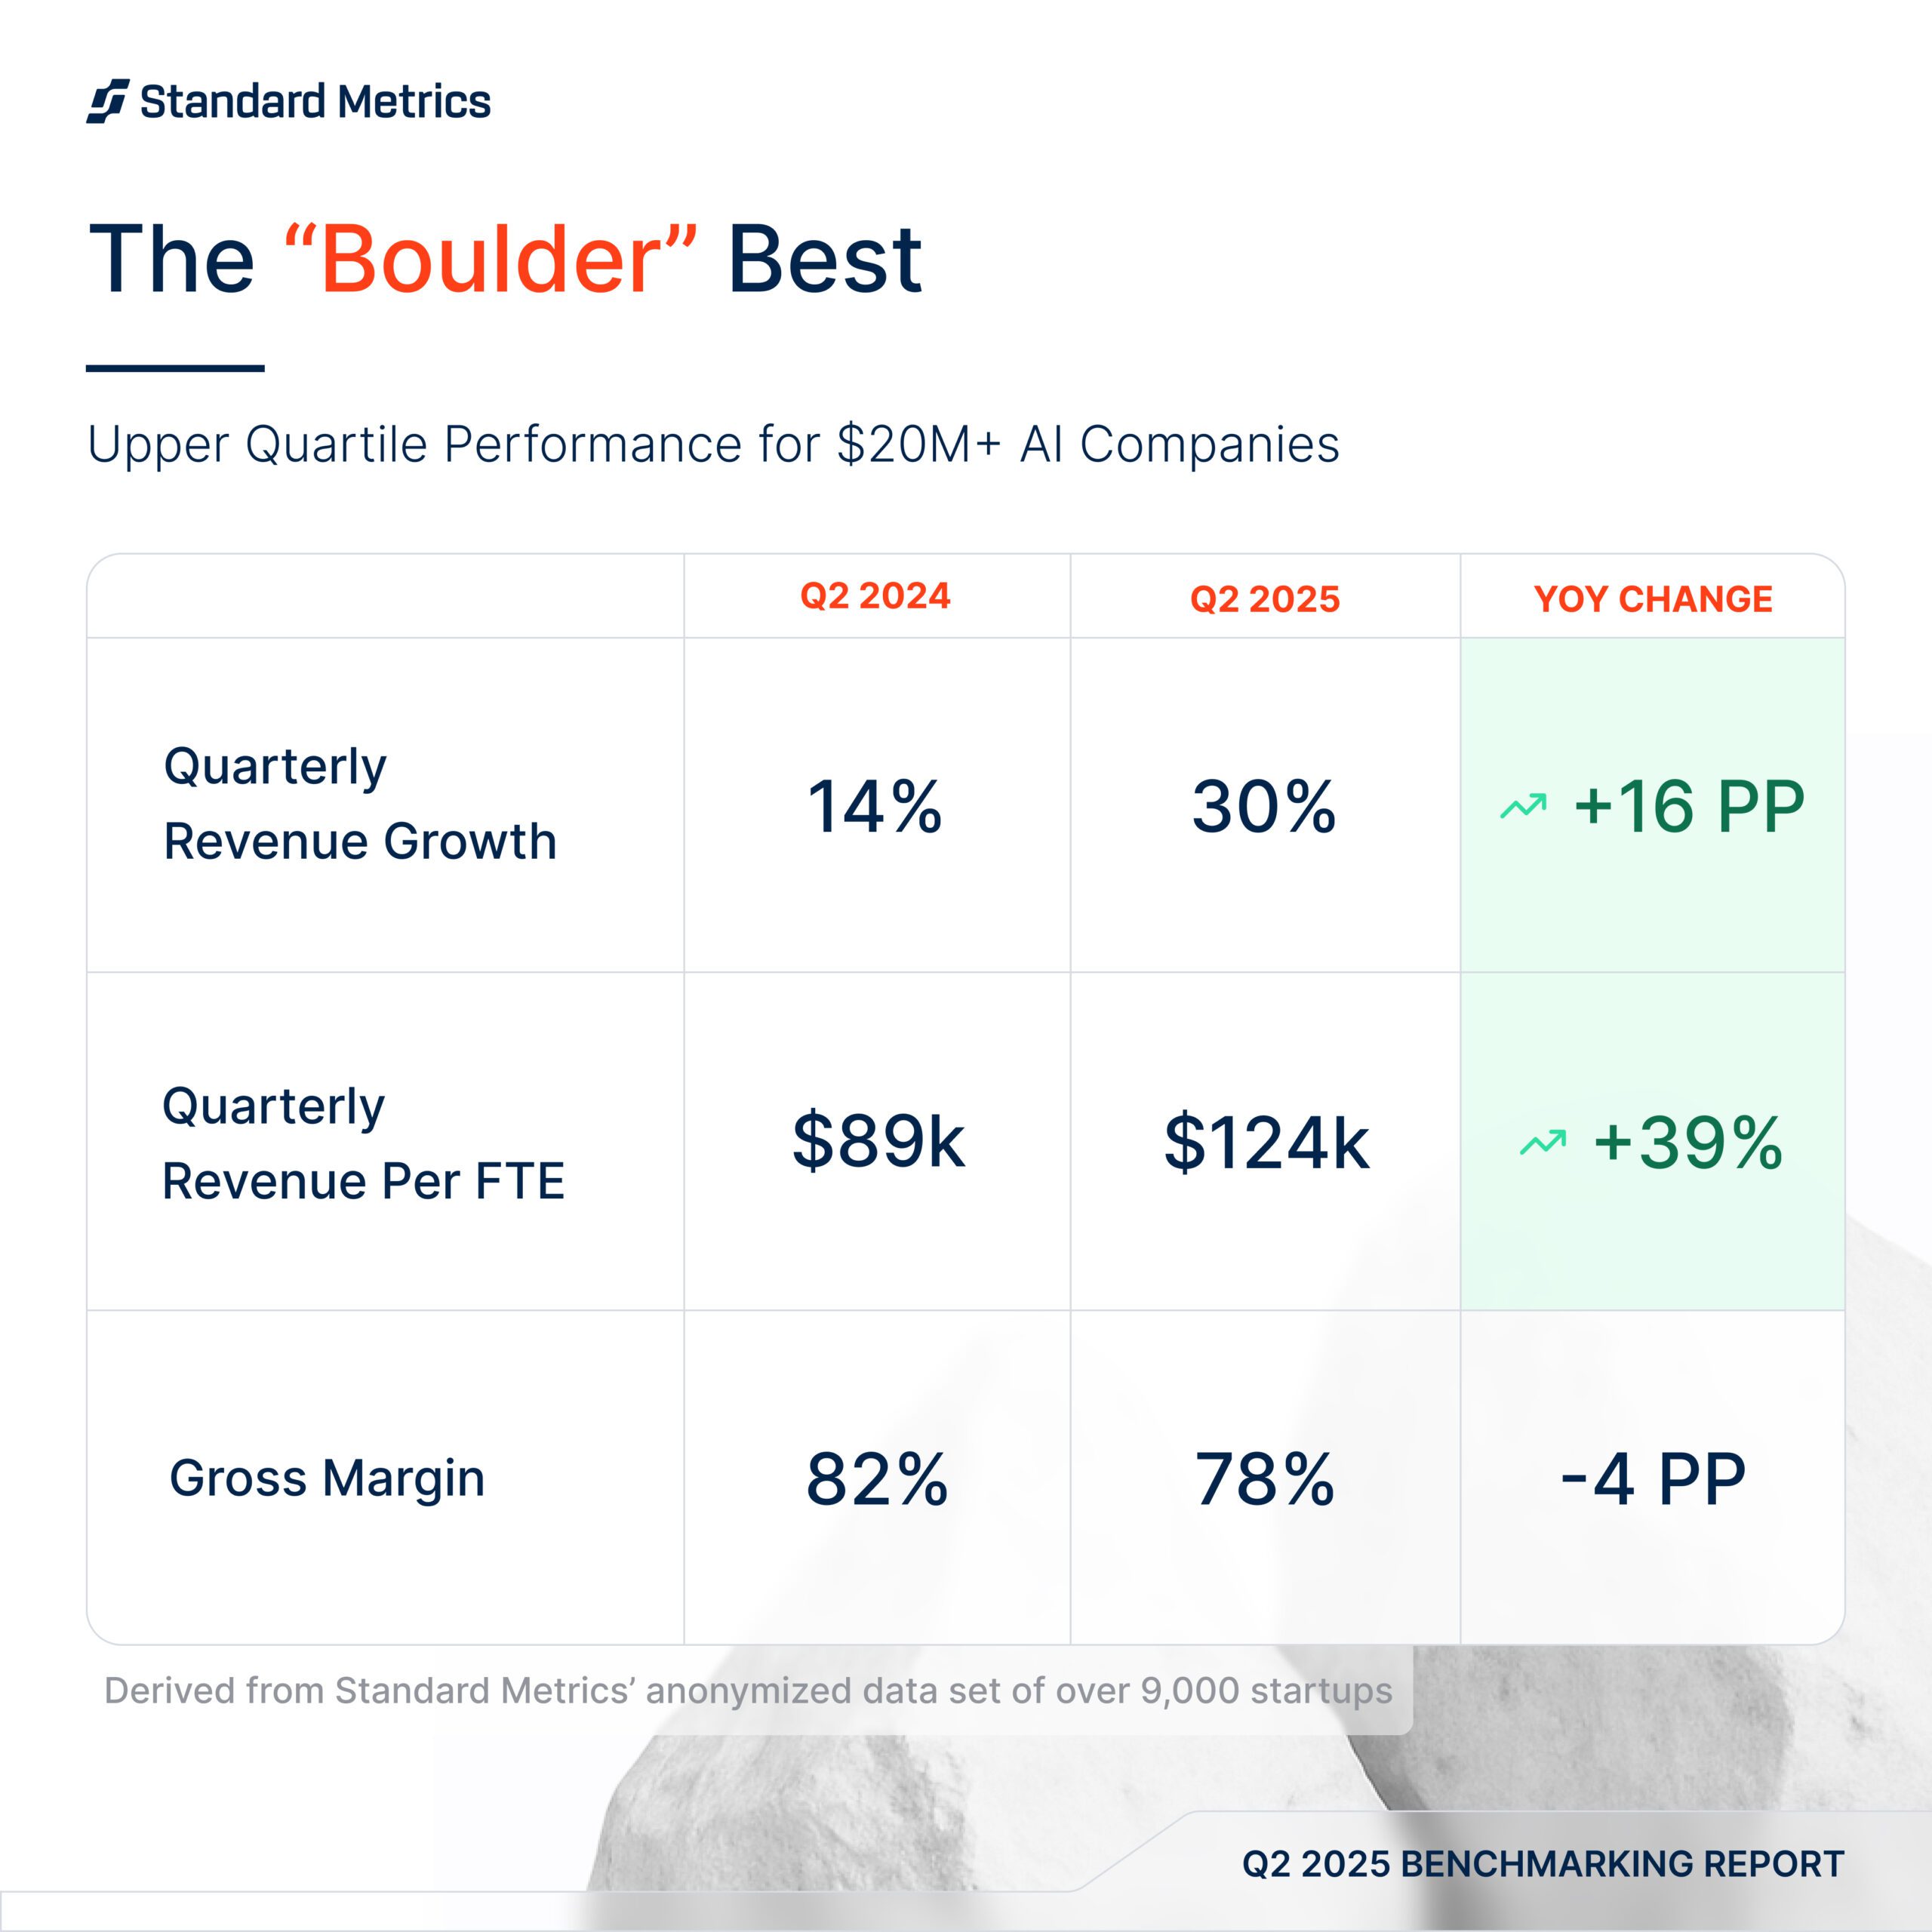
AI Boulders ($20M+ in annual revenue): The best keep winning
Top quartile AI Boulders (AI startups with $20M+ in annualized revenue) largely outpaced all-sector peers in quarterly revenue growth, spiking at 41% in Q1 2025 compared to the broader market’s 17%. While revenue growth has converged closer to all sectors the last quarter, AI Boulders still greatly outpace in growth: in Q2 we still saw a 10 percentage point difference.
N=86
Top quartile AI Boulders also closed the revenue per FTE efficiency gap with their all-sector counterparts. Quarterly revenue per full time employee (FTE) in Q2 2025 reached $124K, a YoY improvement of 39%. AI Boulders are proving that they are able to reach workforce productivity while scaling.
N=67
Gross margin trends reveal some cracks in AI Boulders (though certainly not a true fault line). As we did with AI Rocks, we will also be comparing AI Boulders to SaaS in this gross margin analysis for better one-to-one comparison. Top-quartile AI Boulders saw margins above SaaS peers in parts of 2023 and 2024, but those levels slightly eroded into 2025.
N=85
At $20M+ in revenue, top quartile AI Boulders are demonstrating that they can achieve revenue per FTE efficiency, outsized growth, and average margins.
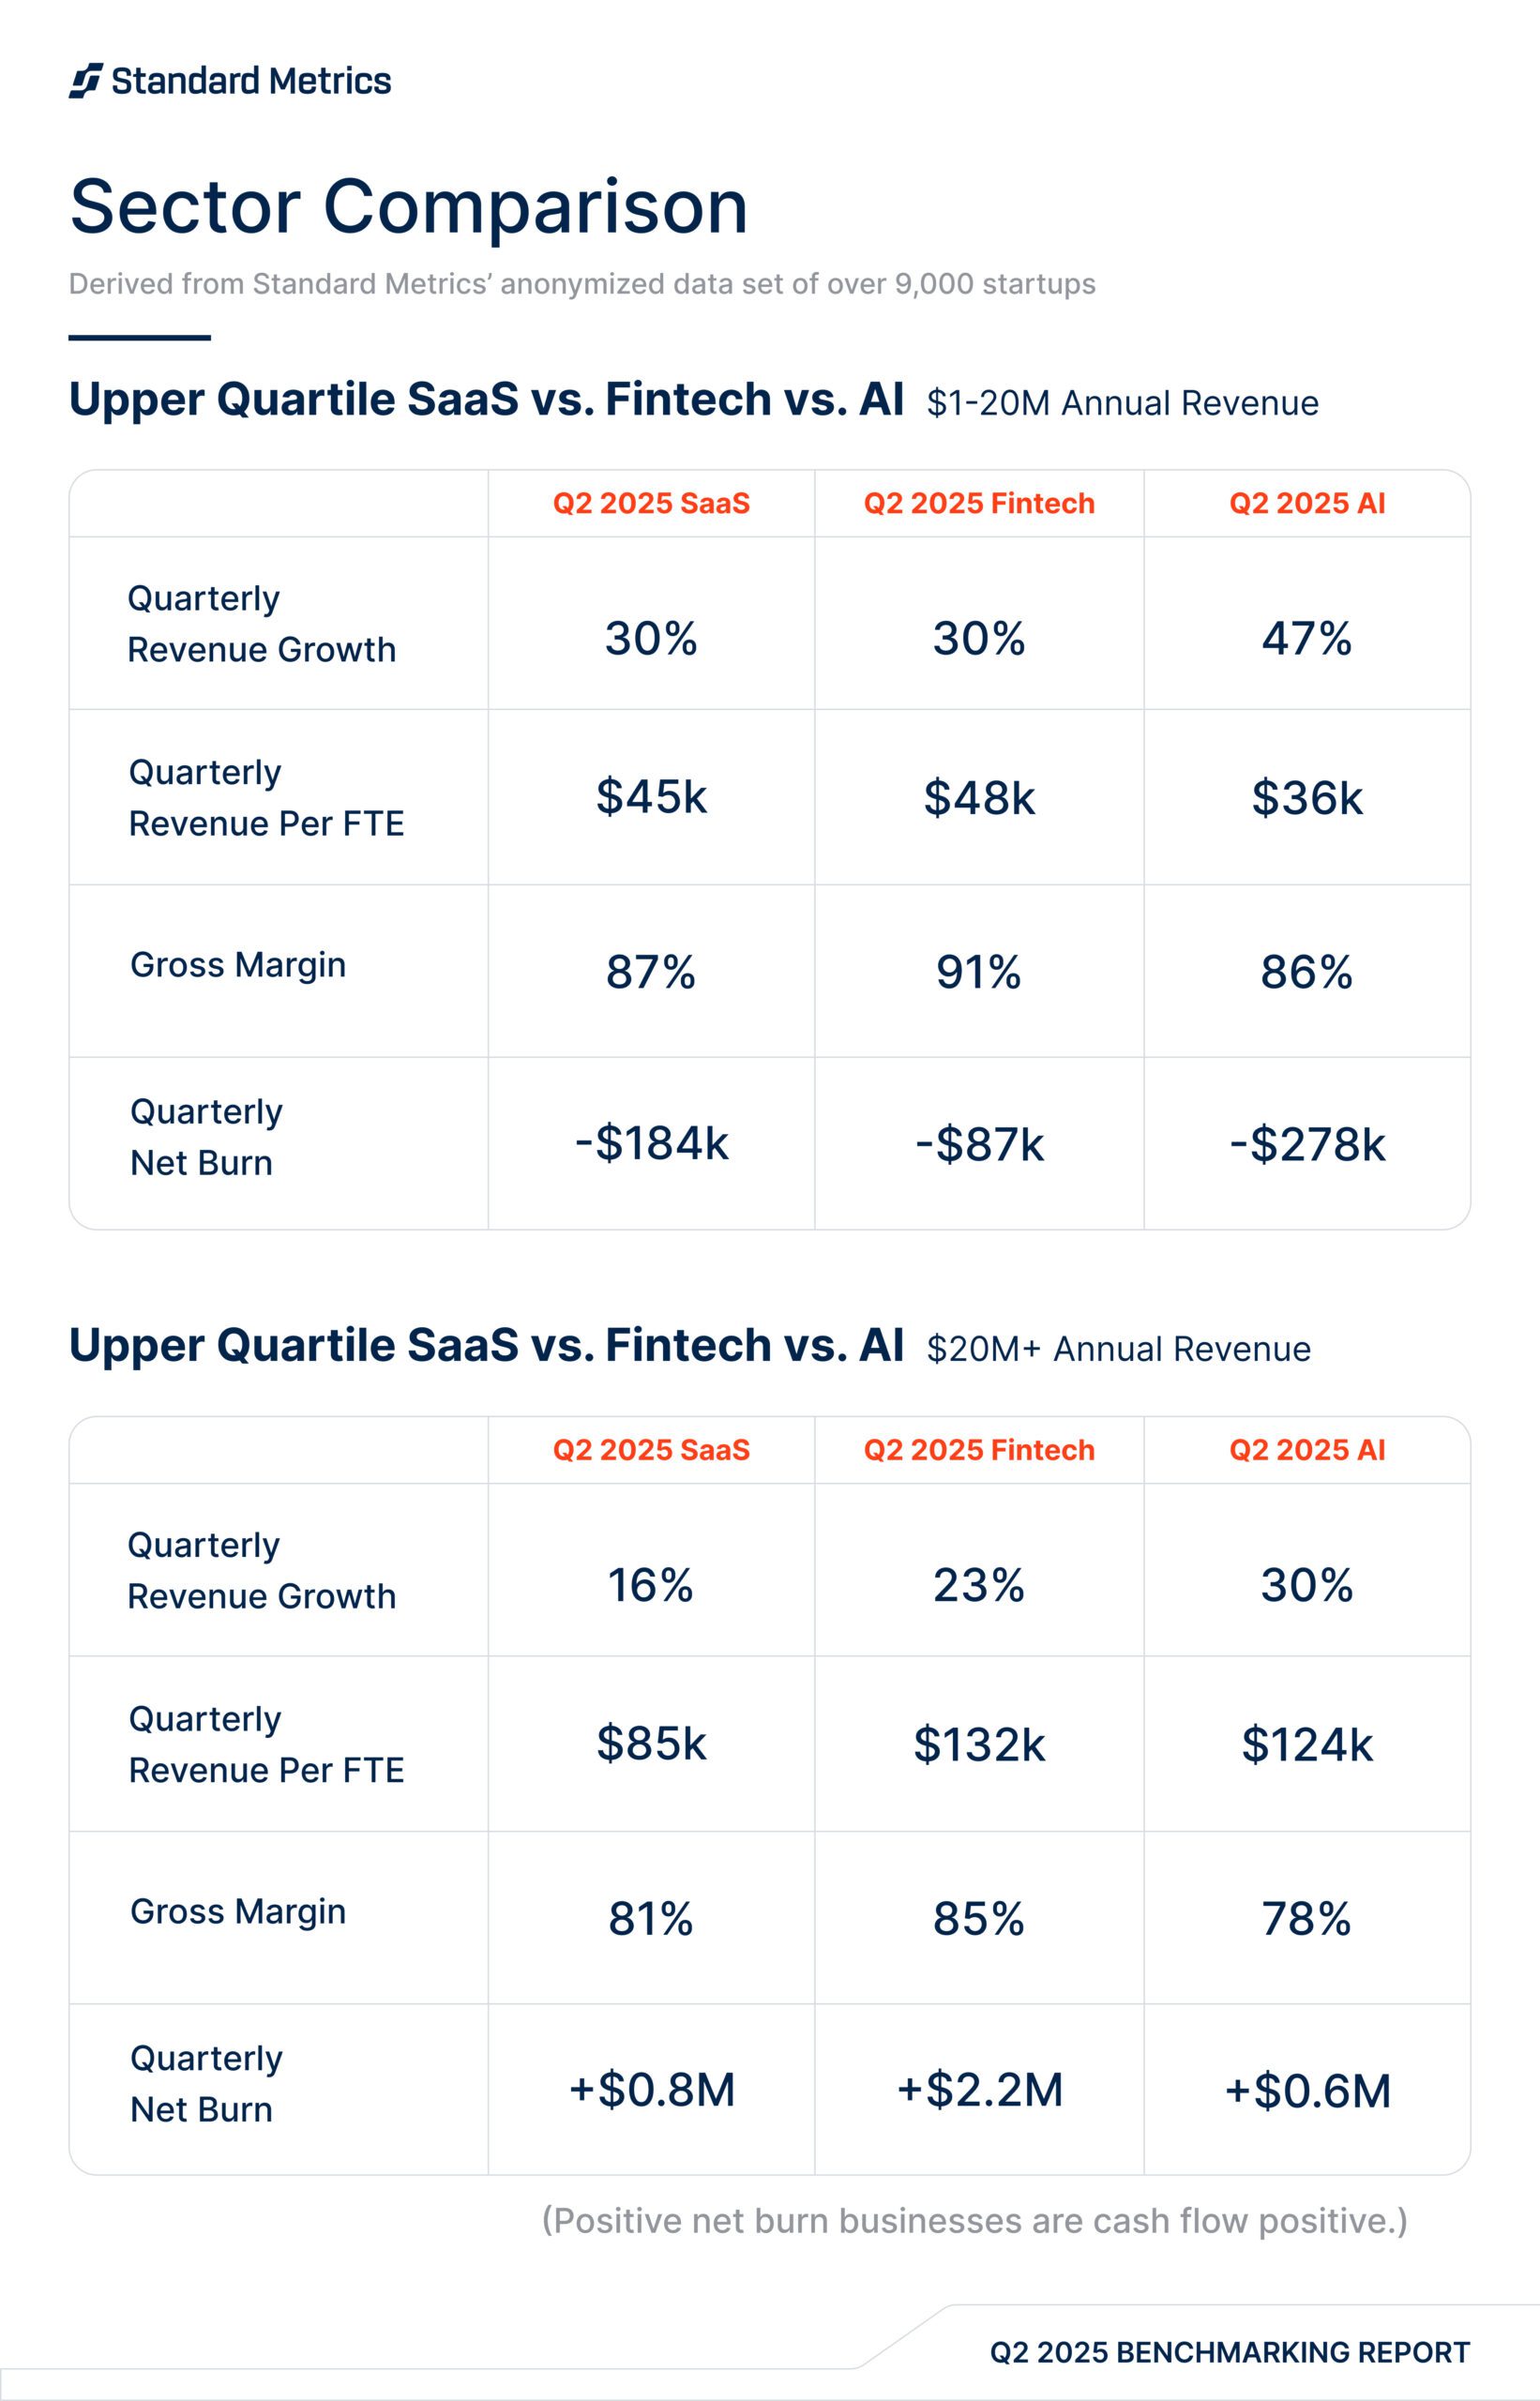
So how does AI stack up to fintech and SaaS?
Note: This section was refreshed on 12/4/25 following a review of the underlying calculations.
Last quarter, we looked at how fintech and SaaS compared to one another. Here we bring AI into the mix.
At the $20M+ annualized revenue band, upper quartile AI companies are growing significantly faster than peers in SaaS and fintech in 2025. While there have been periods in the past where fintech startups have surpassed AI companies’ quarterly revenue growth, SaaS companies have lagged consistently behind since early 2023.
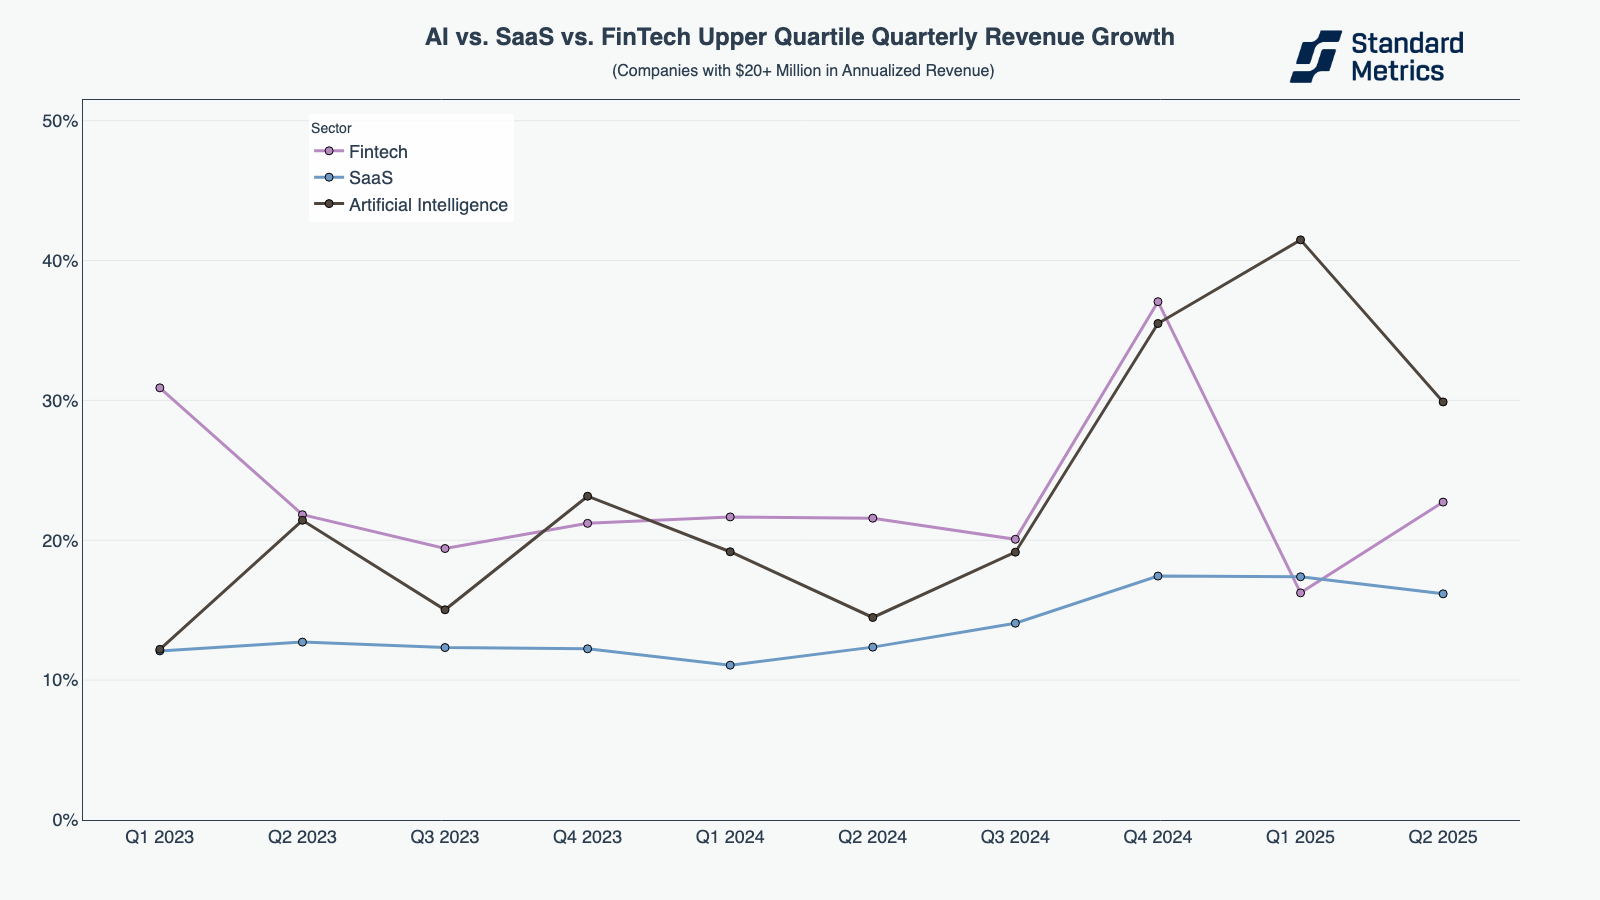
N=86
At the $100M+ annualized revenue band, fintech companies have once again consistently outpaced SaaS companies in revenue growth. We do not have adequate data on AI companies with $100M+ in annualized revenue to present results here.
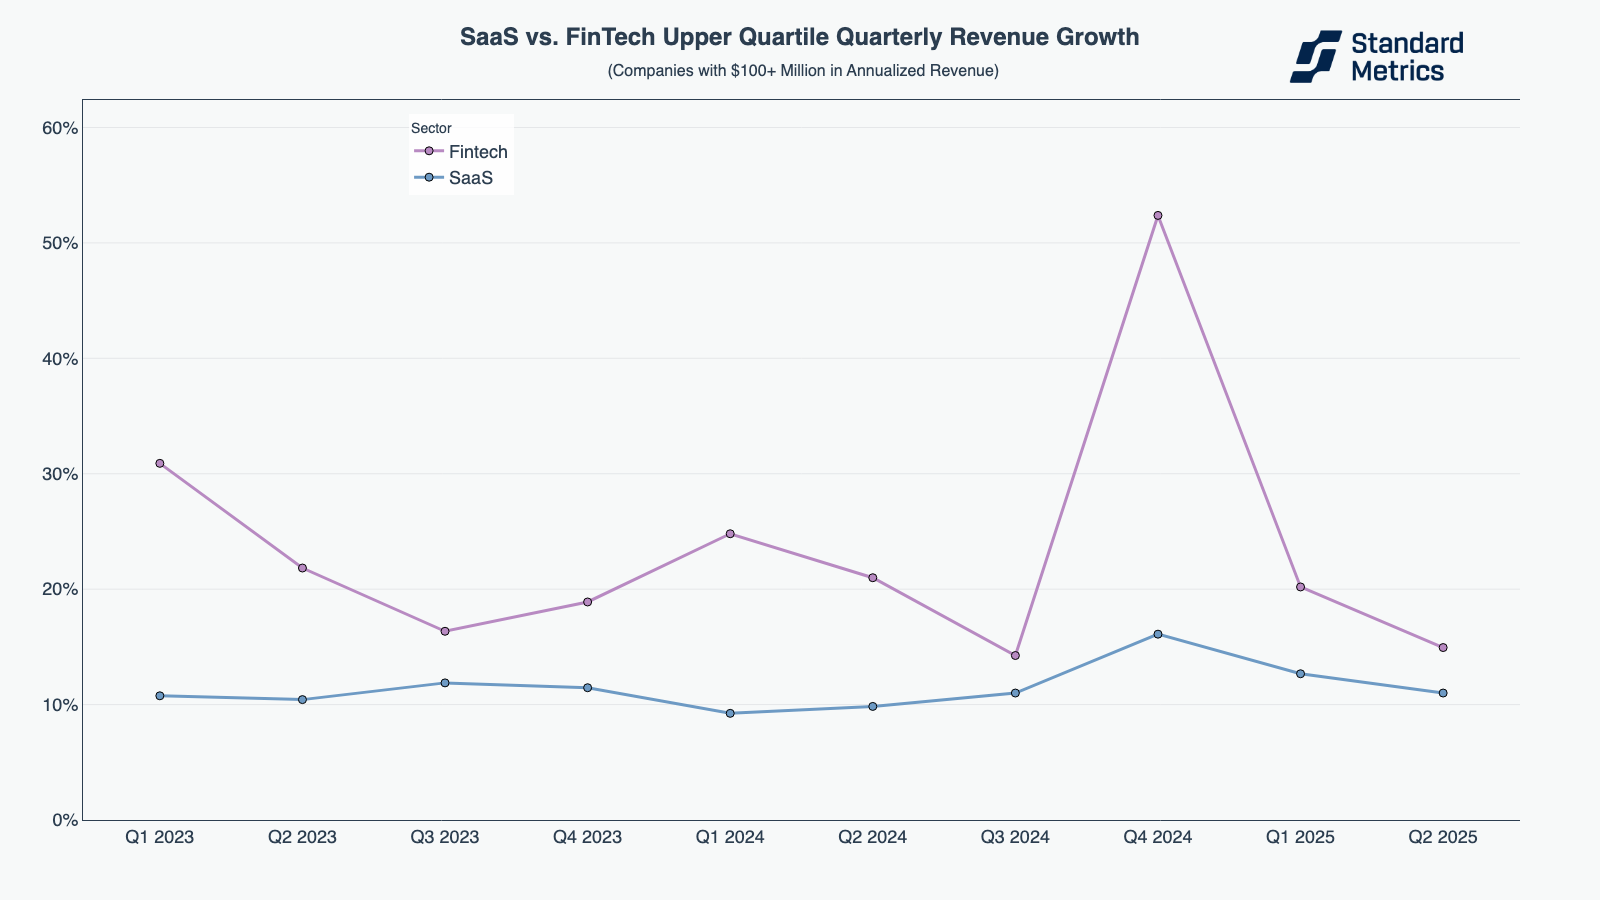
N=71
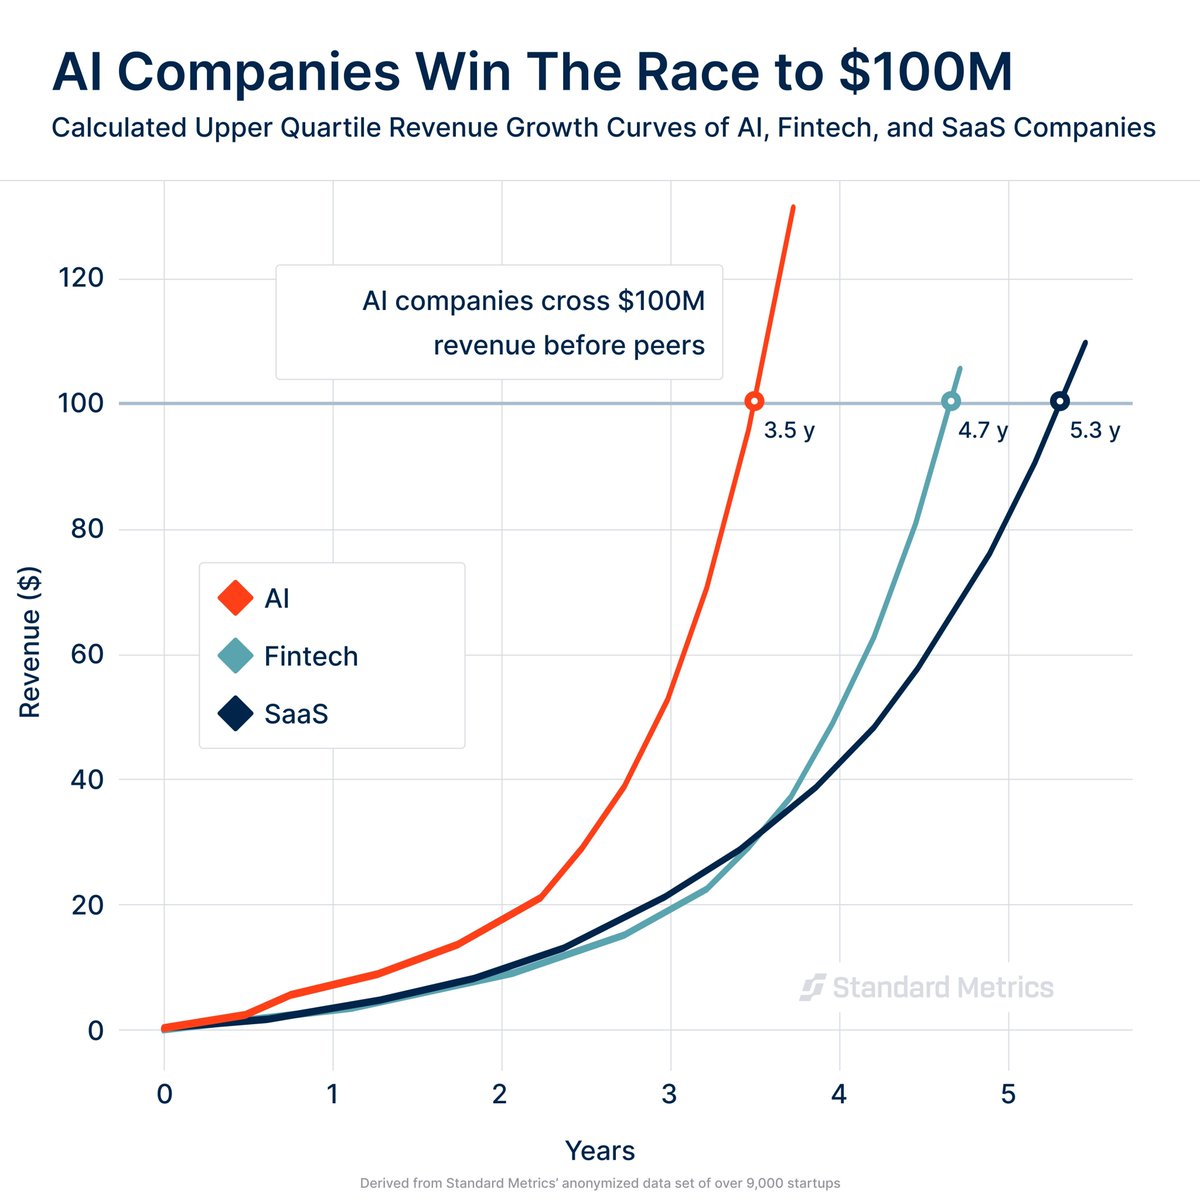
Due to these outsized growth rates, the average upper quartile AI startup is able to reach $100M in revenue much more quickly than fintech and SaaS companies.
The chart below showcases how quickly a hypothetical upper quartile grower in each sector scales from $1M to $100M. This chart uses Standard Metrics’ latest benchmarked revenue growth rates from upper quartile companies to model growth starting from $1M in revenue. Growth compounds each quarter, with rates granularly adjusted by revenue range: $1–5M, $5–20M, and $20–100M.
As further guidance for interpreting the chart below: the upper growth quartile of AI companies at $1M in annualized revenue that stay in the upper quartile (which is a significantly smaller population than start in that quartile) will make it to $100M in 3.5 years.
Upper quartile AI companies look largely like their SaaS counterparts in terms of their EBITDA profile outside of temporary spikes in Q4 2023 and Q1 2025. Fintech companies are consistently more profitable.
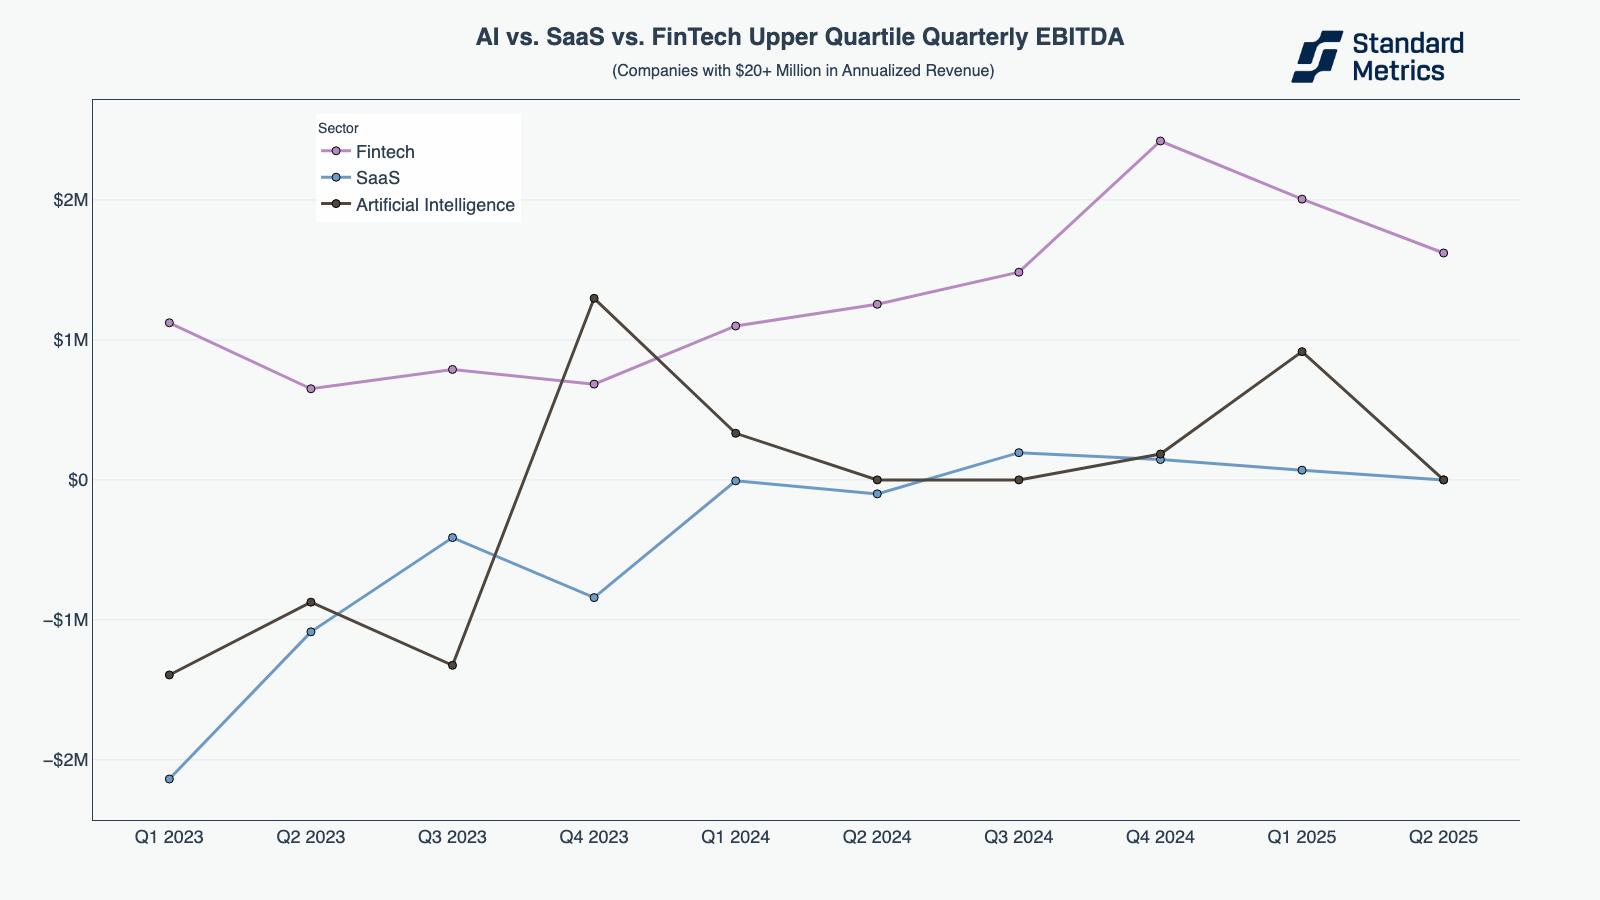
N=56
When it comes to burn, fintech is also the clear leader.
Upper quartile, $20M+ annualized revenue fintech companies reached zero burn in early 2023 and have continued to generate more cash and outperform AI and SaaS since then. Upper quartile, $20M+ AI and SaaS companies have also seen improvements in burn, reaching zero in late 2024. However, they trail fintech.
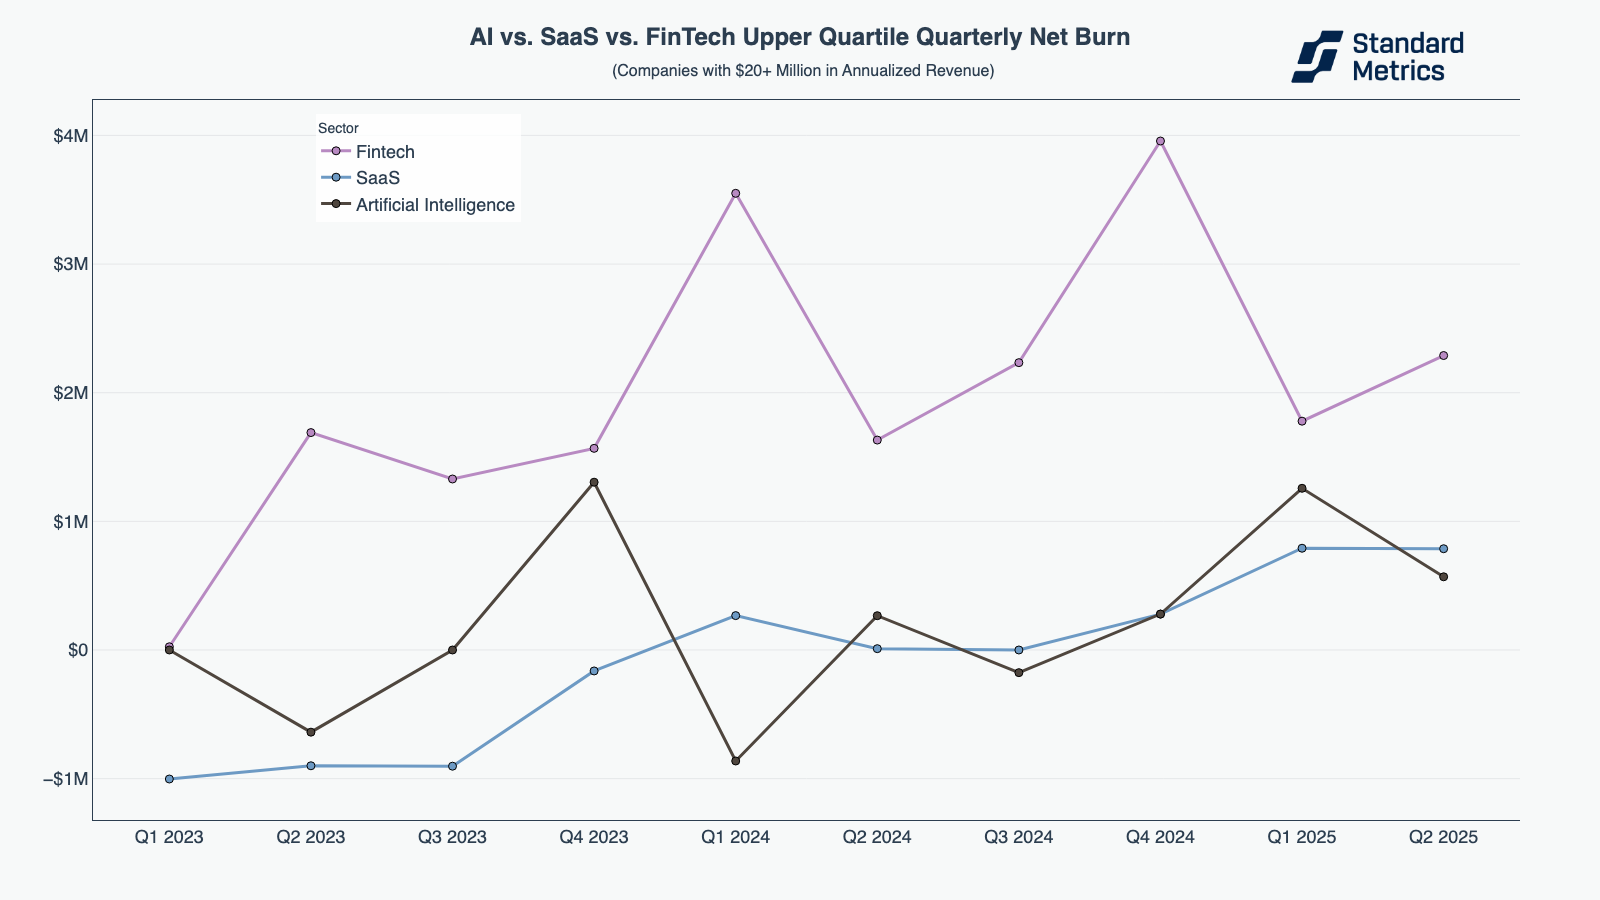
N=77
The late-stage AI sector has moved from hyper-growth to sustainable, efficient scaling over the past two years, making it a true competitor for the more mature fintech and SaaS industries. Late stage AI companies are growing rapidly, and now doing so with slightly lower burn and improved EBITDA. SaaS sees similar EBITDA and burn, and much lower growth than AI. Fintech drives stronger EBITDA performance and burns significantly less than AI, however can’t grow quite as quickly.
And what about IPO readiness for all companies?
In Q4 2024, we discussed how late-stage startups were building towards IPO and M&A readiness with a focus on better EBITDA and reduced burn. In Q1 2025, we saw stability in these metrics (rather than further growth) and, in Q2 2025, we see this stability continue. This points to a long-term new normal of efficiency for median mid- and late-stage startups. However, the startups that are most likely to IPO may be those who can beat peers in revenue growth (while maintaining efficiency).
While median companies in the $5-20M and $20-100M annualized revenue ranges are burning slightly more than last quarter, $100M+ companies are burning slightly less (once again inching closer to zero burn).
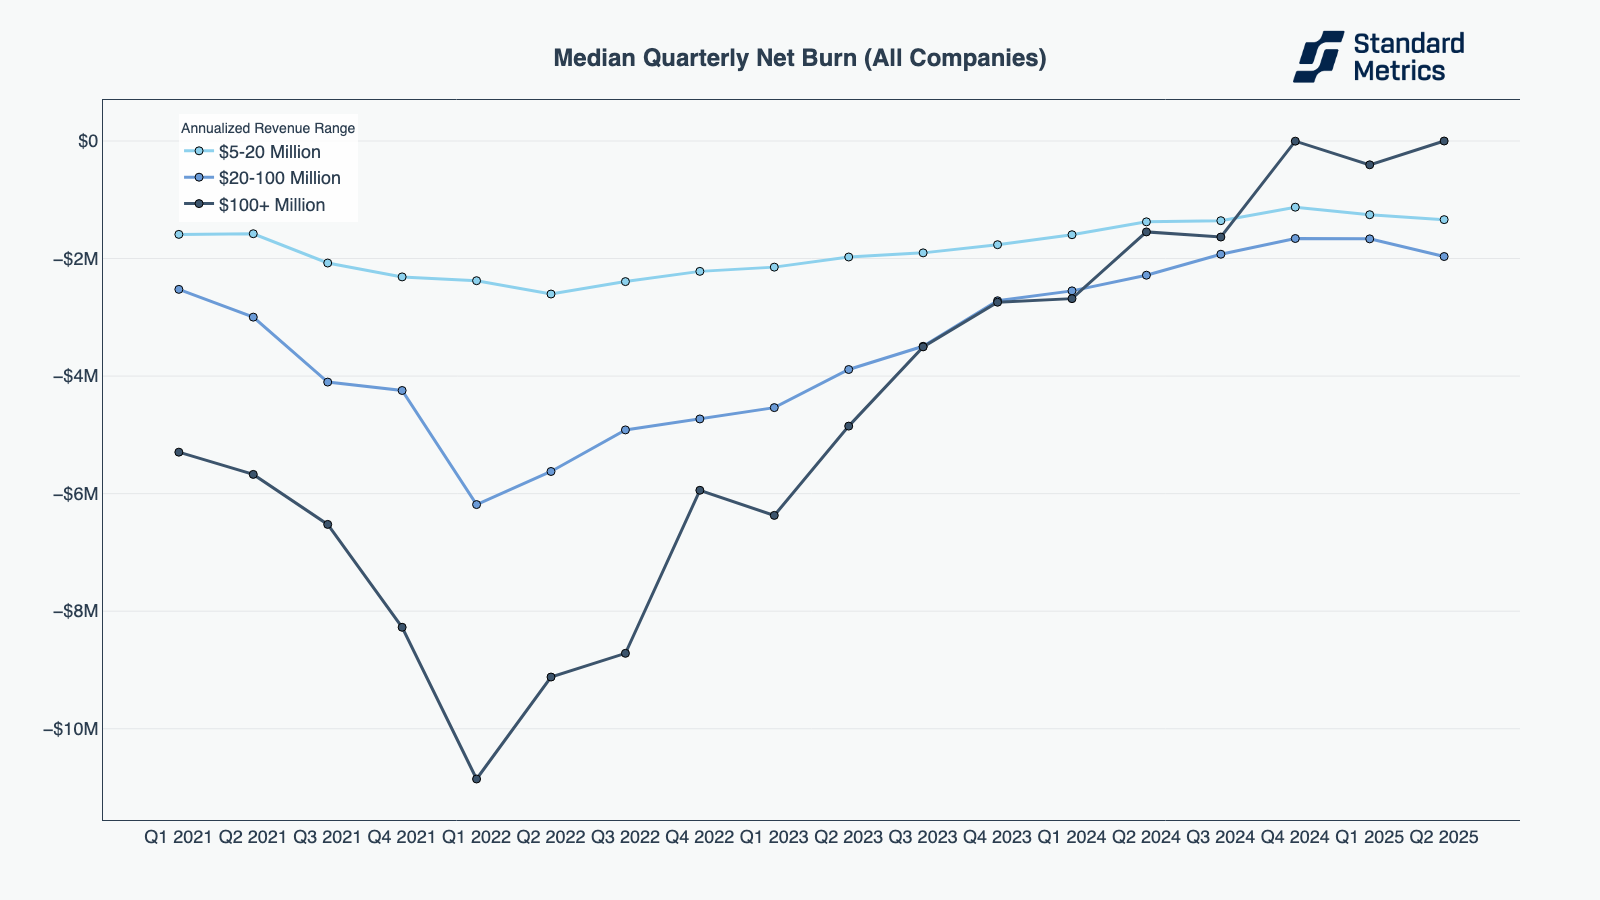
N=313
In median EBIDTA, too, we see relative consistency for mid-stage and late-stage companies, with the previous year’s upward trend flattening into a steady state for each revenue band.
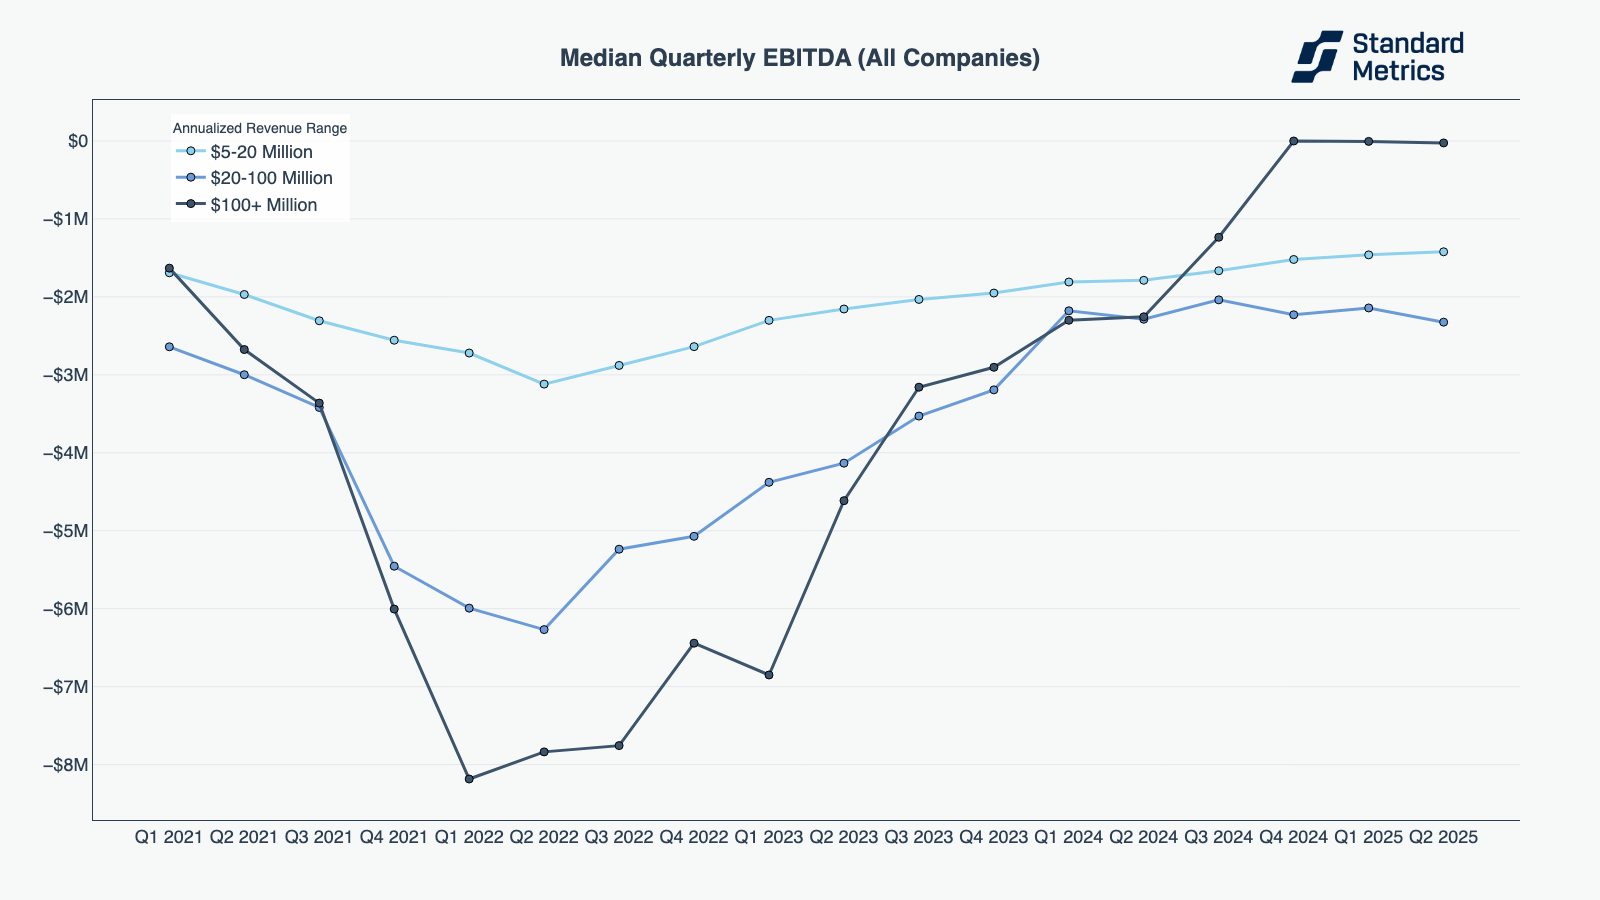
N=257
In workforce productivity we also see a consistent ability for companies to do more with less. Median quarterly revenue per FTE ticked up for mid-stage companies and stayed flat for late-stage companies.
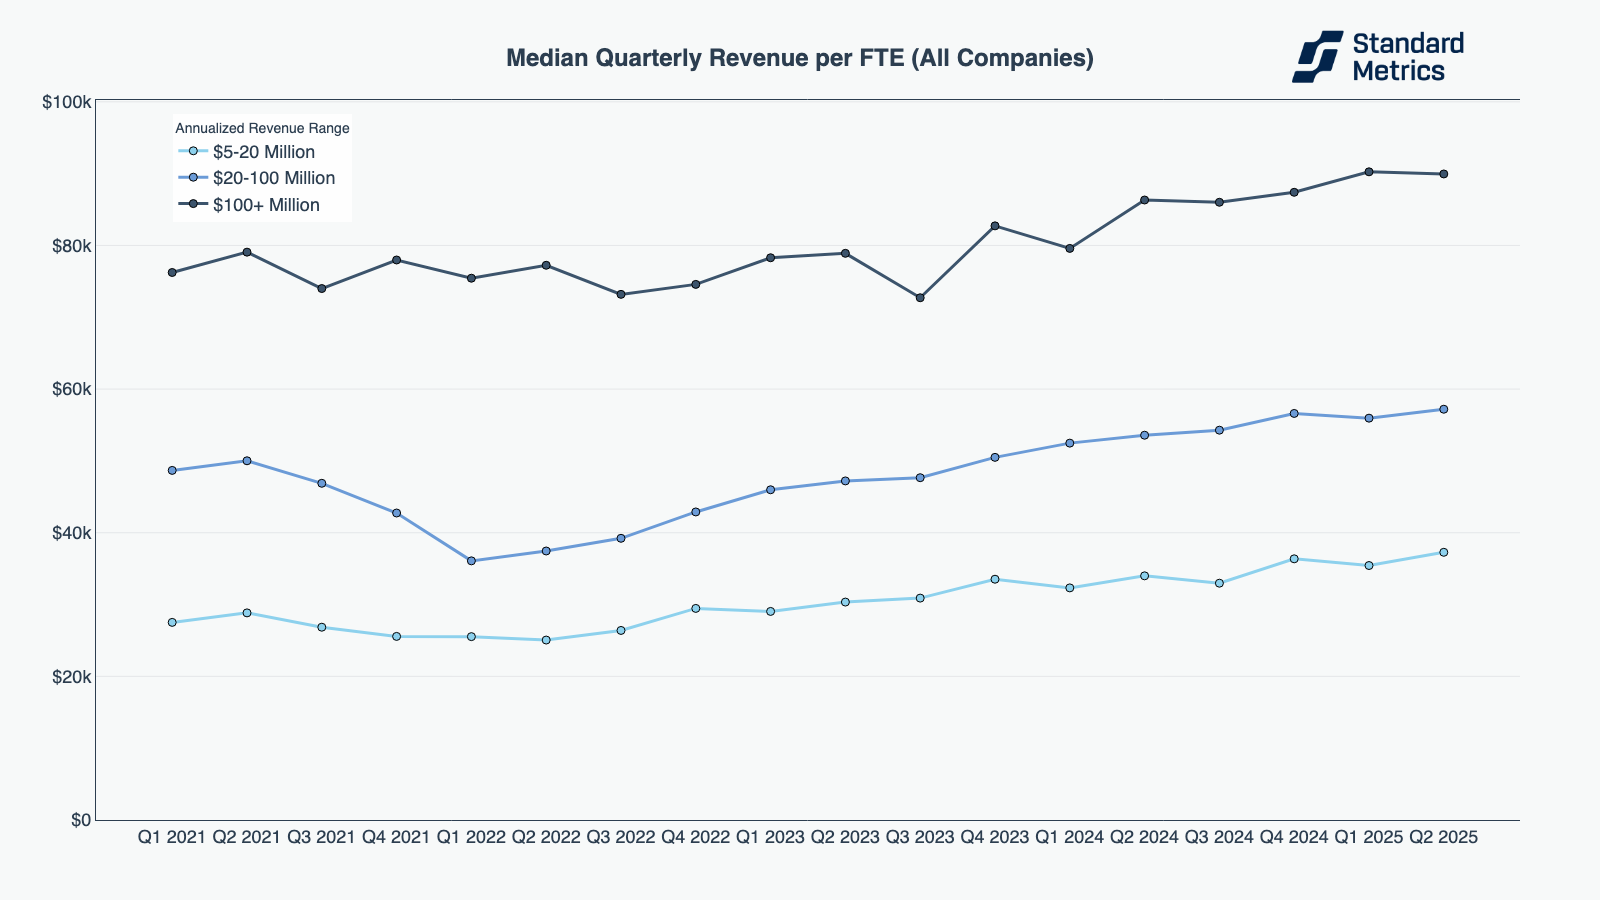
N=303
The median mid-stage and late-stage company reached a steady state of efficiency in Q2 2025. After a bump in efficiency in Q4 2024, we see companies holding on to their gains quarter-after-quarter despite some analysts pointing to macroeconomic headwinds.
However, this efficiency comes in a time of lowered revenue growth across industries. Growth has been relatively flat since 2023, significantly below 2021 peaks.
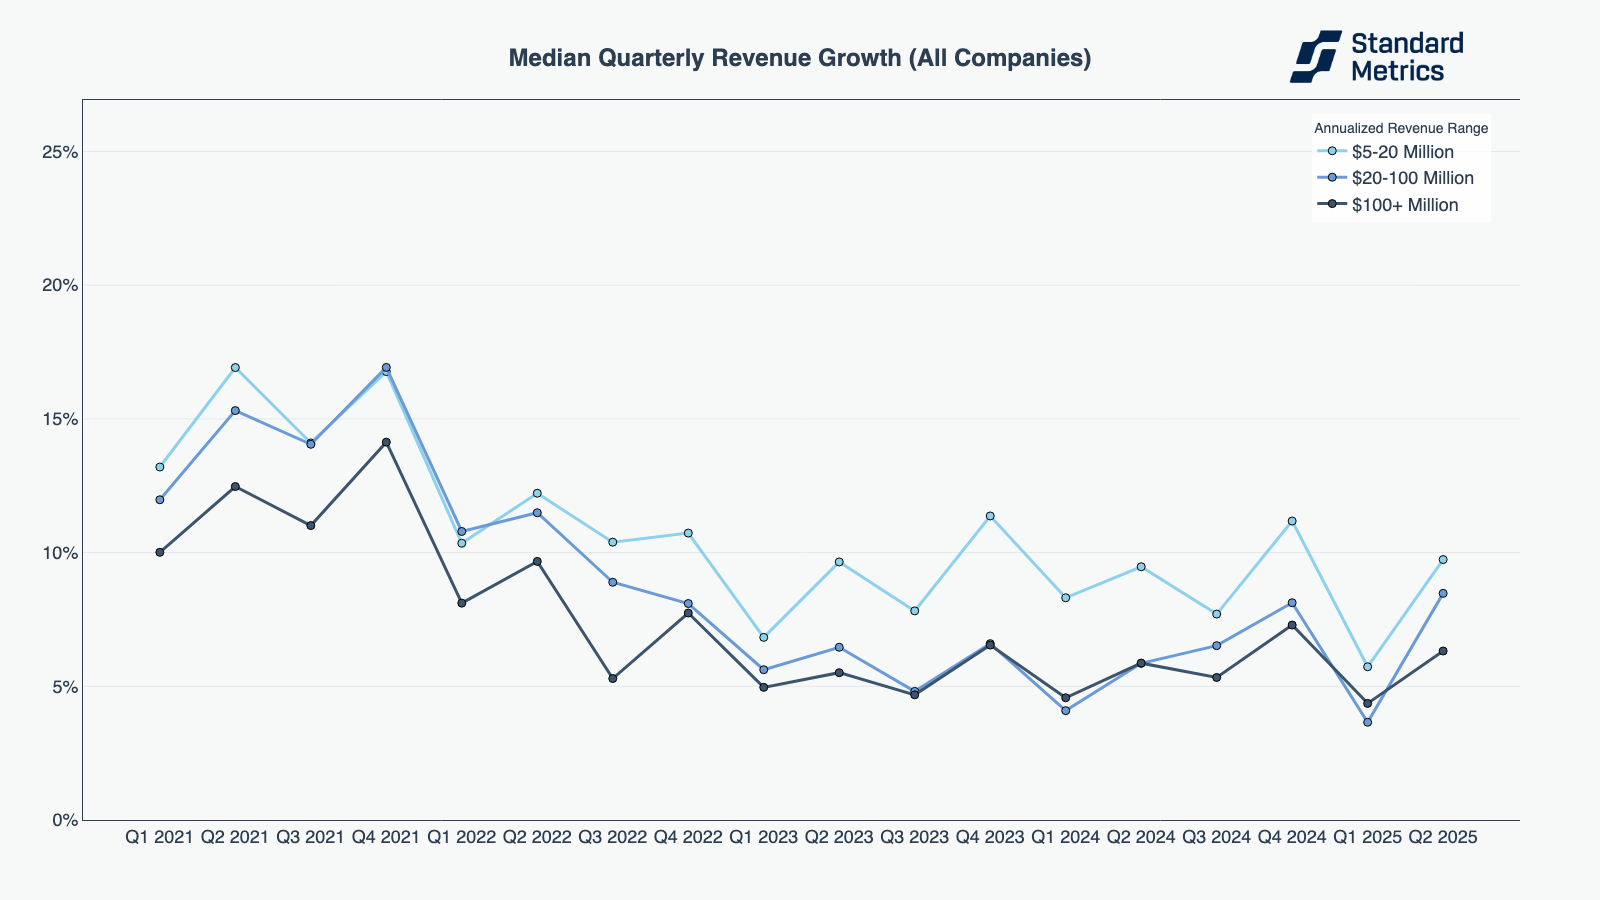
N=360
Even at the upper quartile, we see a decline and now flattening in the curve of quarterly revenue growth for mid- and late-stage companies.
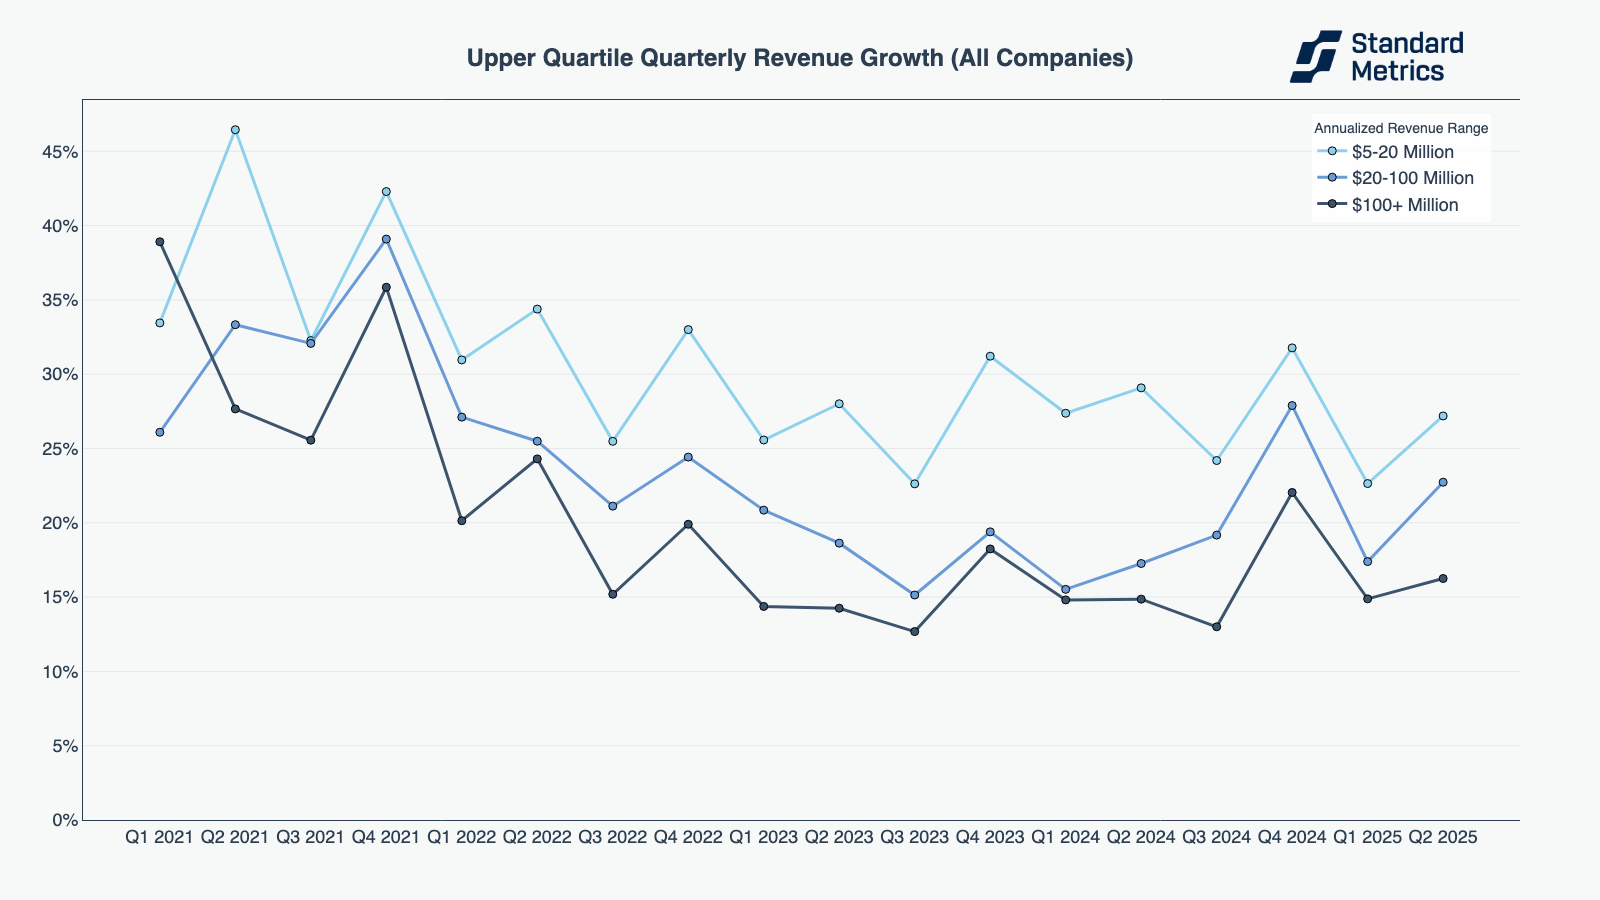
N=360
While the median mid- and late-stage startup is showing efficiency, the startups that pair that efficiency with outsized growth will emerge the victors in the race to going public.
Methodology
This report summarizes data from over 9,000 anonymized startups who report data to their investors on Standard Metrics. Companies are included in an annualized revenue bucket based on their annualized revenue value calculated in each respective quarterly period. Companies self-identify their sector at time of onboarding onto our platform and can update their sector at any time afterwards. Companies are in control of their data on Standard Metrics and can opt out of their data being included in anonymous benchmarking anytime. The underlying composition of company data on Standard Metrics can shift over time as new companies join or leave (e.g. IPO, M&A, shut down) our platform.
For graphs that represent multiple revenue buckets of companies [e.g. “Median Net Burn (All Companies)” chart above], our N count is the minimum number of companies across the smallest cohort in the most recent period (e.g. “Q2 2025”). For graphs analyzing a single revenue bucket on one metric, N is the number of companies in the most recent period in the chart. Data points must have at least 30 companies to be shown.
Automate your portfolio reporting
Find out how you can:
- Collect a higher volume of accurate data
- Analyze a robust, auditable data set
- Deliver insights that drive fund performance