

We’re excited to announce our latest Standard Metrics startup benchmarking report, covering the most interesting stories that we saw in the private markets in Q1 2025.
Q1 2025 was a quarter with huge headlines: a presidential inauguration, shifting trade policies, and continued improvements to and growth in AI.
The latest Global Benchmarking data from Standard Metrics — the portfolio data management platform for over 100 VC firms and 9,000 startups — highlights how startups performed amid these changes. We dive into Q1 revenue growth trends, explore how the SaaS vs. fintech industries are faring under an AI explosion, and look back to see if our Q4 2024 narrative of startups gearing up for IPOs still is accurate a quarter later.
We hope these insights provide helpful context into the previously-opaque private markets with real, anonymized data from over 9,000 startups across industries, sizes, and geographies. Whether you’re preparing for a portfolio review, heading into a board meeting, or putting finishing touches on a forward-looking financial plan, we want to give you the fresh benchmarks you need.
A consistently tough first quarter
Standard Metrics’ Global Benchmarking data highlighted a significant drop in quarterly revenue growth across companies of all sizes in Q1 this year — with median quarterly revenue growth dropping between 3 and 5 percentage points quarter-over-quarter. Interestingly, this isn’t just a point-in-time trend: since 2021, we’ve seen companies consistently increase in quarterly revenue growth in Q4, then decline in quarterly revenue growth in Q1.
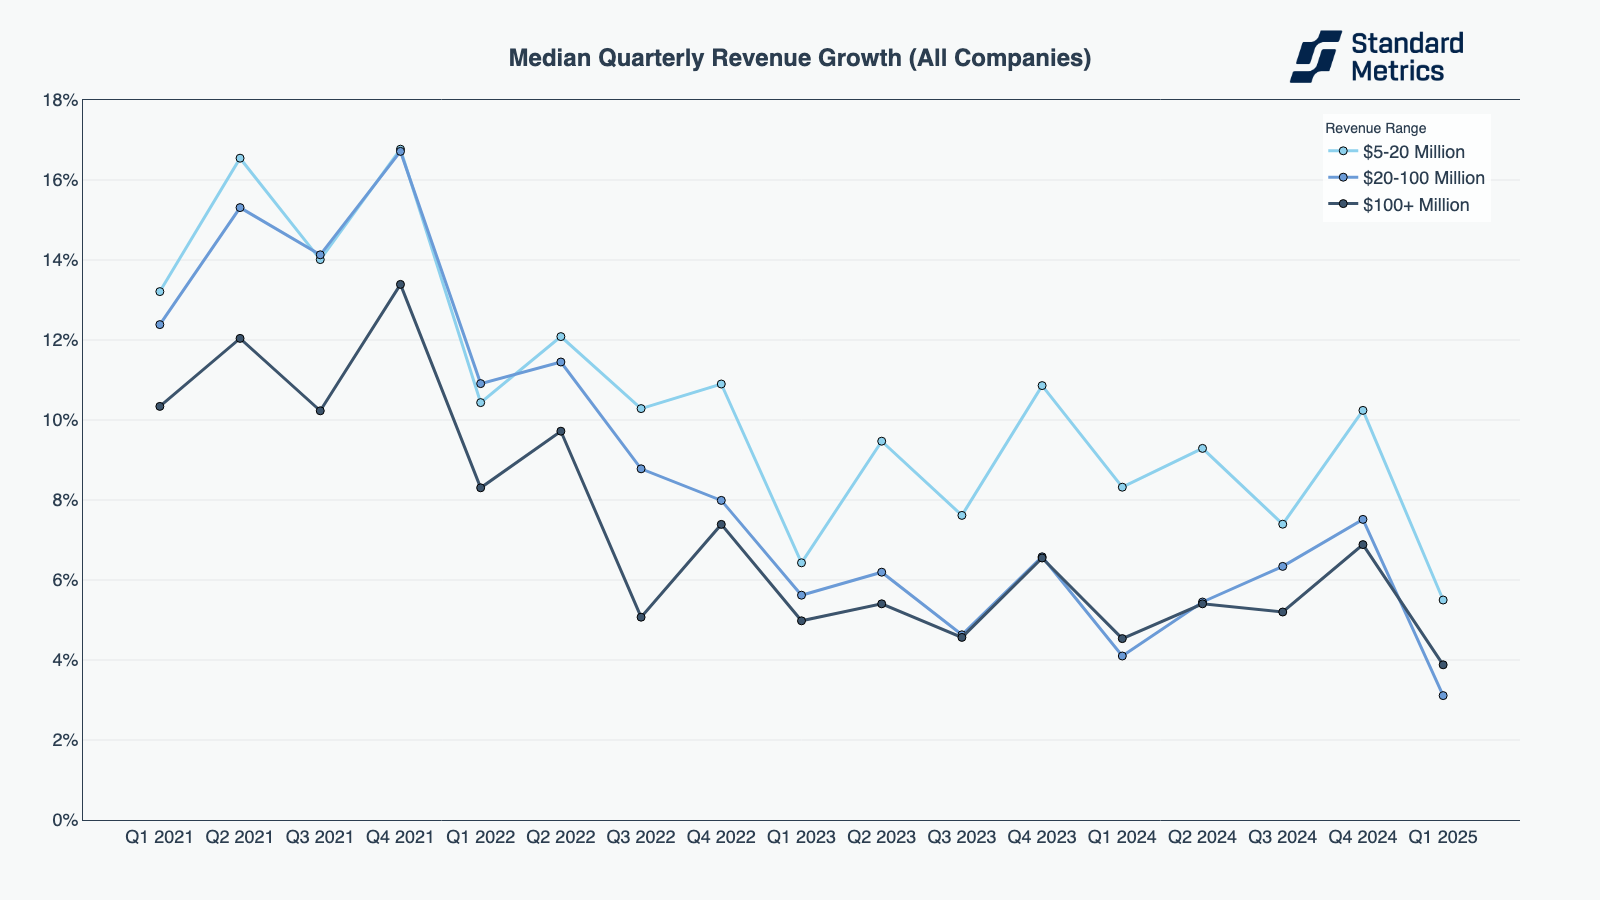
N= 328
This is even true for top performing companies: upper quartile revenue growth dropped by 8 to 10 percentage points quarter-over-quarter in Q1 2025.
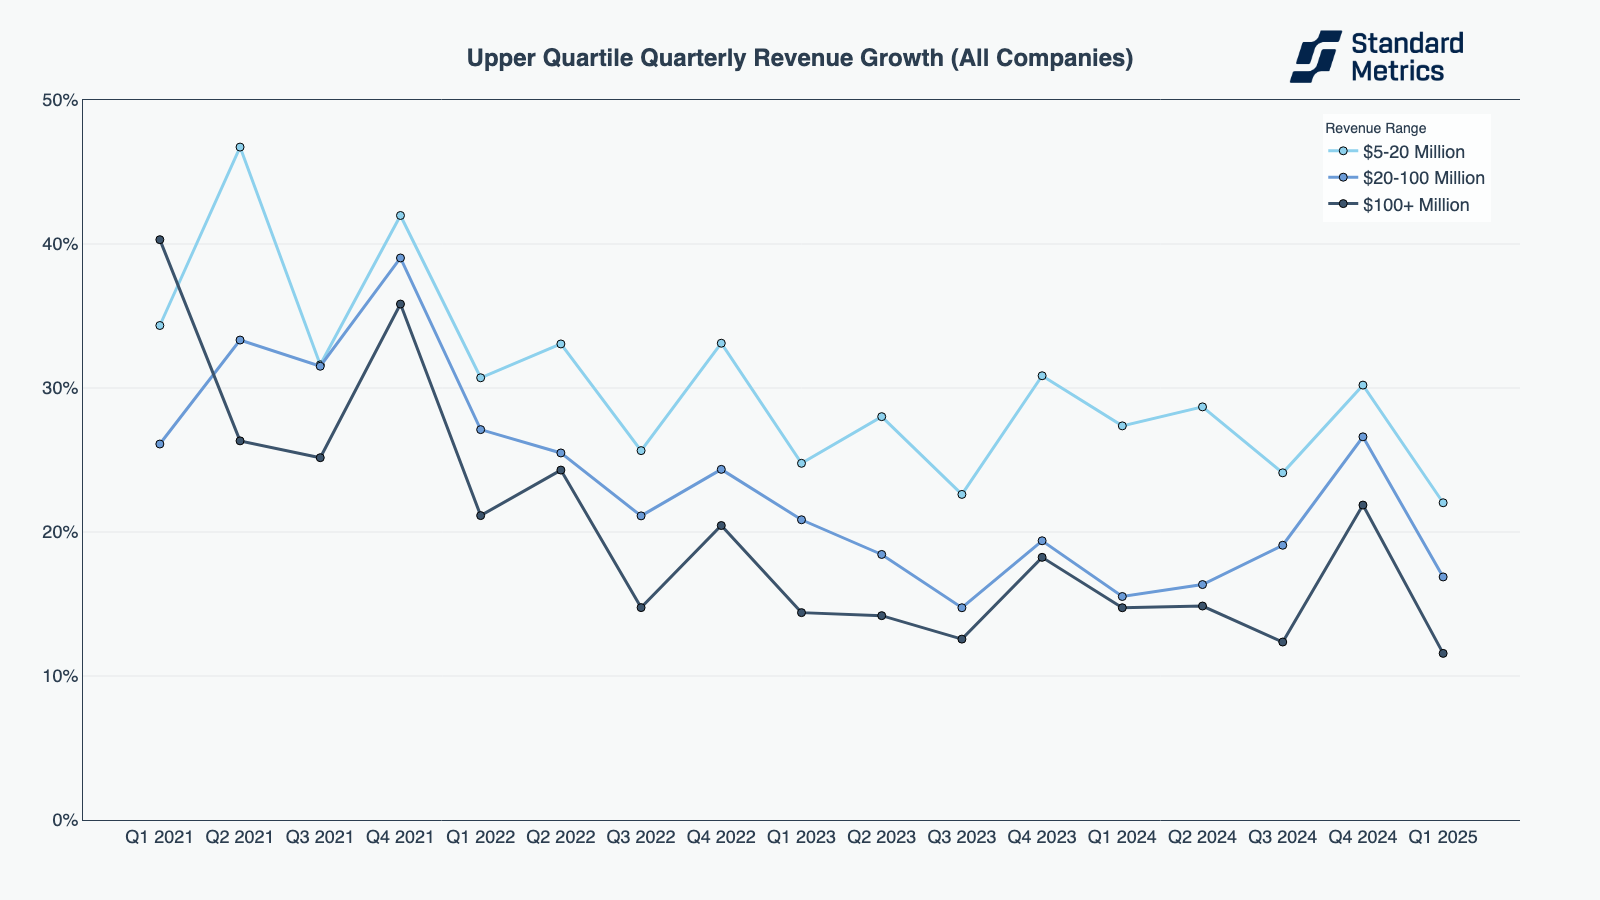
N =328
We were curious if this trend was being influenced by industry biases. Consumer startups, for example, have an almost unavoidable December holiday boost and January post-holiday slump. While consumer startups were most affected by this trend, we saw the same results in other industries like fintech, SaaS, and healthcare.
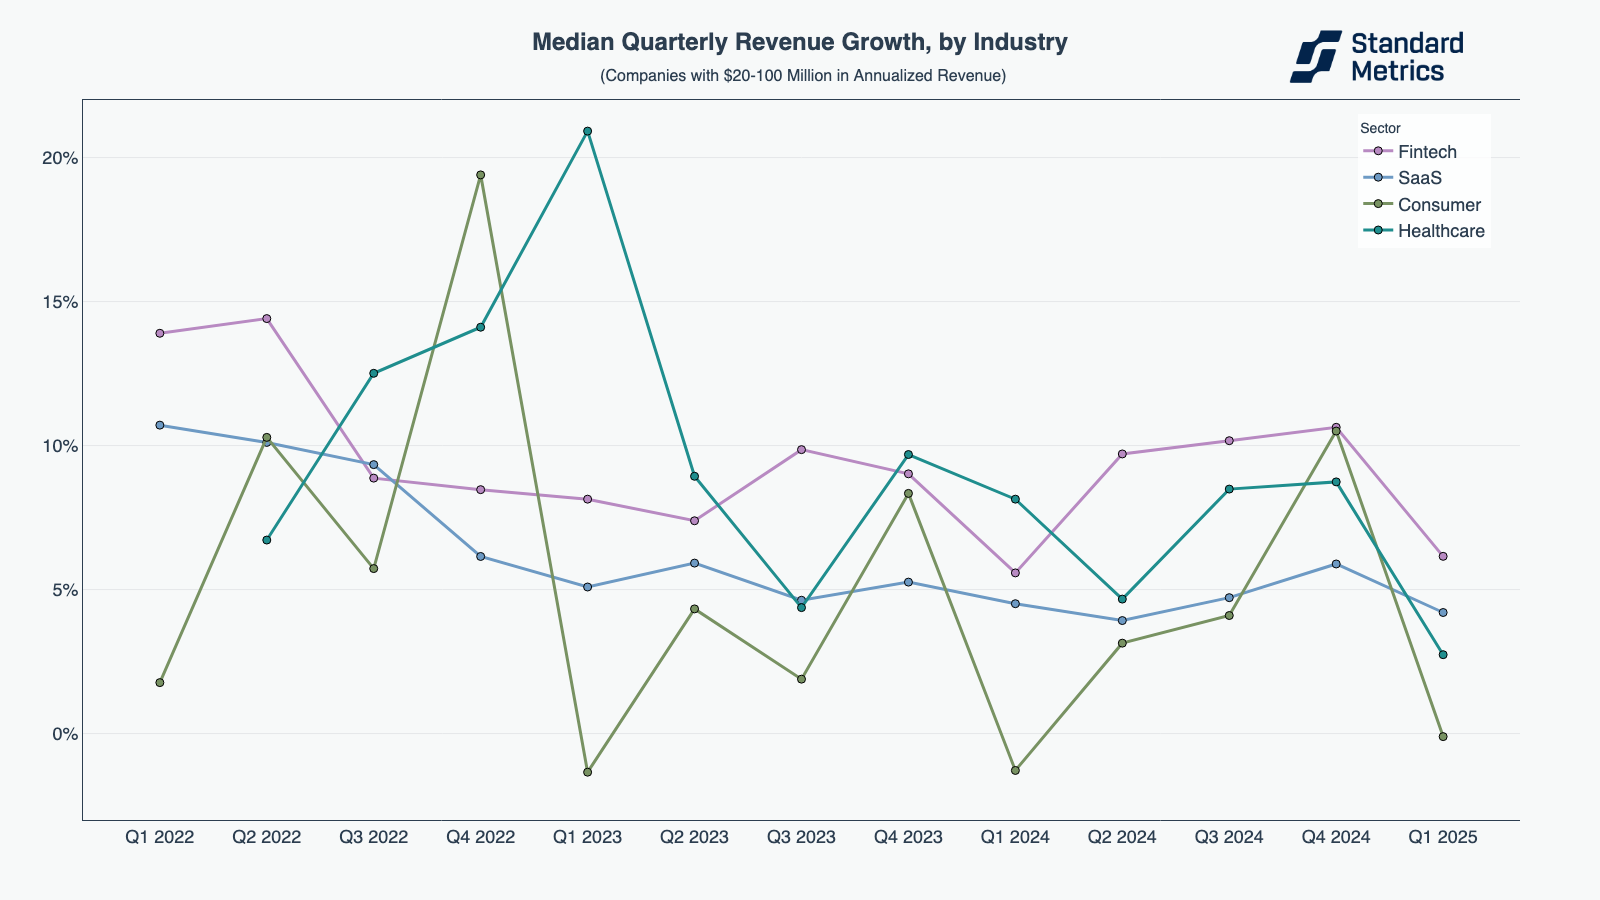
N=66
We were also curious if this performance decrease was affected by macroeconomic headwinds. However, given the cyclical nature of this trend, Standard Metrics didn’t necessarily see tariffs wildly affecting startups in Q1 2025, though future effects remain to be seen. (While President Trump began to research tariffs in February, more active implementation began in April, after the quarter closed.)
Instead, some combination of holiday sales, lower household discretionary income, and startups pushing big deals to close before the holidays may have all been more likely explanations for this consistent Q1 drop.
A tale of two industries: how SaaS and fintech are faring in 2025
Looking at our benchmarking data over time, we’ve seen that fintech companies have slowly regained their footing, while SaaS companies stumble across various performance metrics.
As we covered in more depth above, everyone had a tough first quarter this year in revenue growth. So while midsize fintech (with $20 to 100 million in annualized revenue) did see a large drop in median quarterly revenue growth in Q1 2025, the cohort has consistently been outpacing SaaS in the metric since Q3 2022, hovering between ~7% to ~14% quarterly revenue growth.(1) Over the past three quarters, the cohort has also consistently surpassed hardware, health, and consumer in median quarterly revenue growth.

N=112
The best growth stage SaaS and Fintech companies, however, are showing that profitability is possible. It took 3 years for this cohort to pivot from the free money era of 2021 to now (and top mid-size performers in fintech have outpaced those in SaaS most quarters), but EBITDA for upper quartile companies in both industries looks very impressive where we stand in Q1 2025.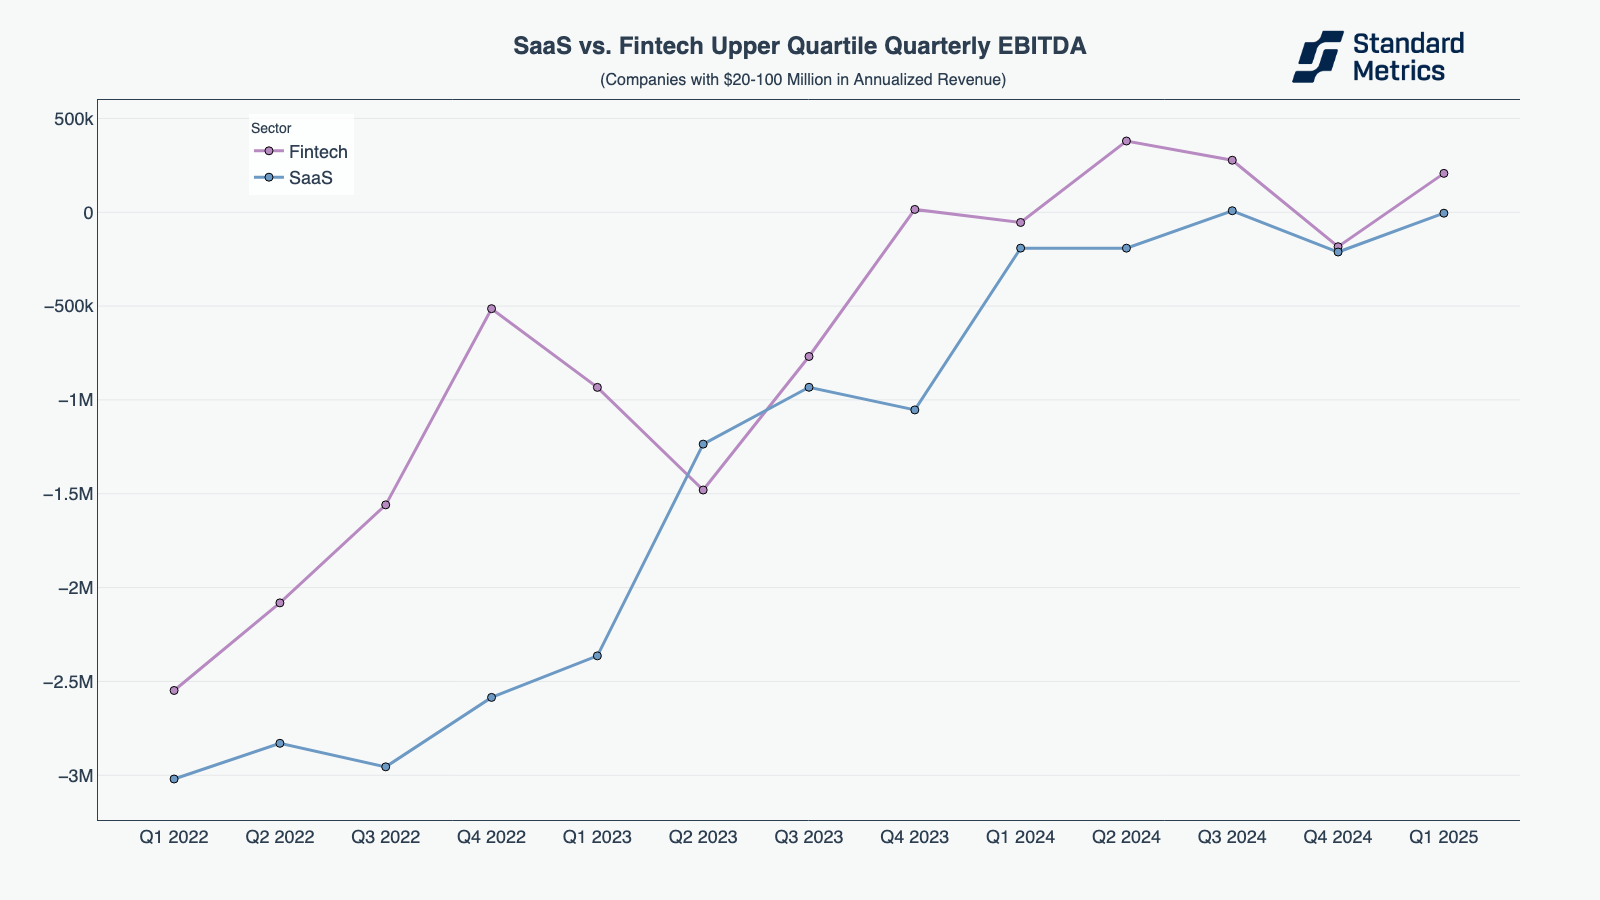
N=71
However, a gap in EBITDA performance between the two industries becomes striking at the upper quartile of late-stage companies. While upper quartile fintech companies with $100M+ in revenue have remained profitable since Q1 2022, they reached a new high at $14.2 million this quarter. Upper quartile SaaS companies at this revenue band, meanwhile dropped from $2.8 million in Q4 2024 to $0.4 million in Q1 2025.
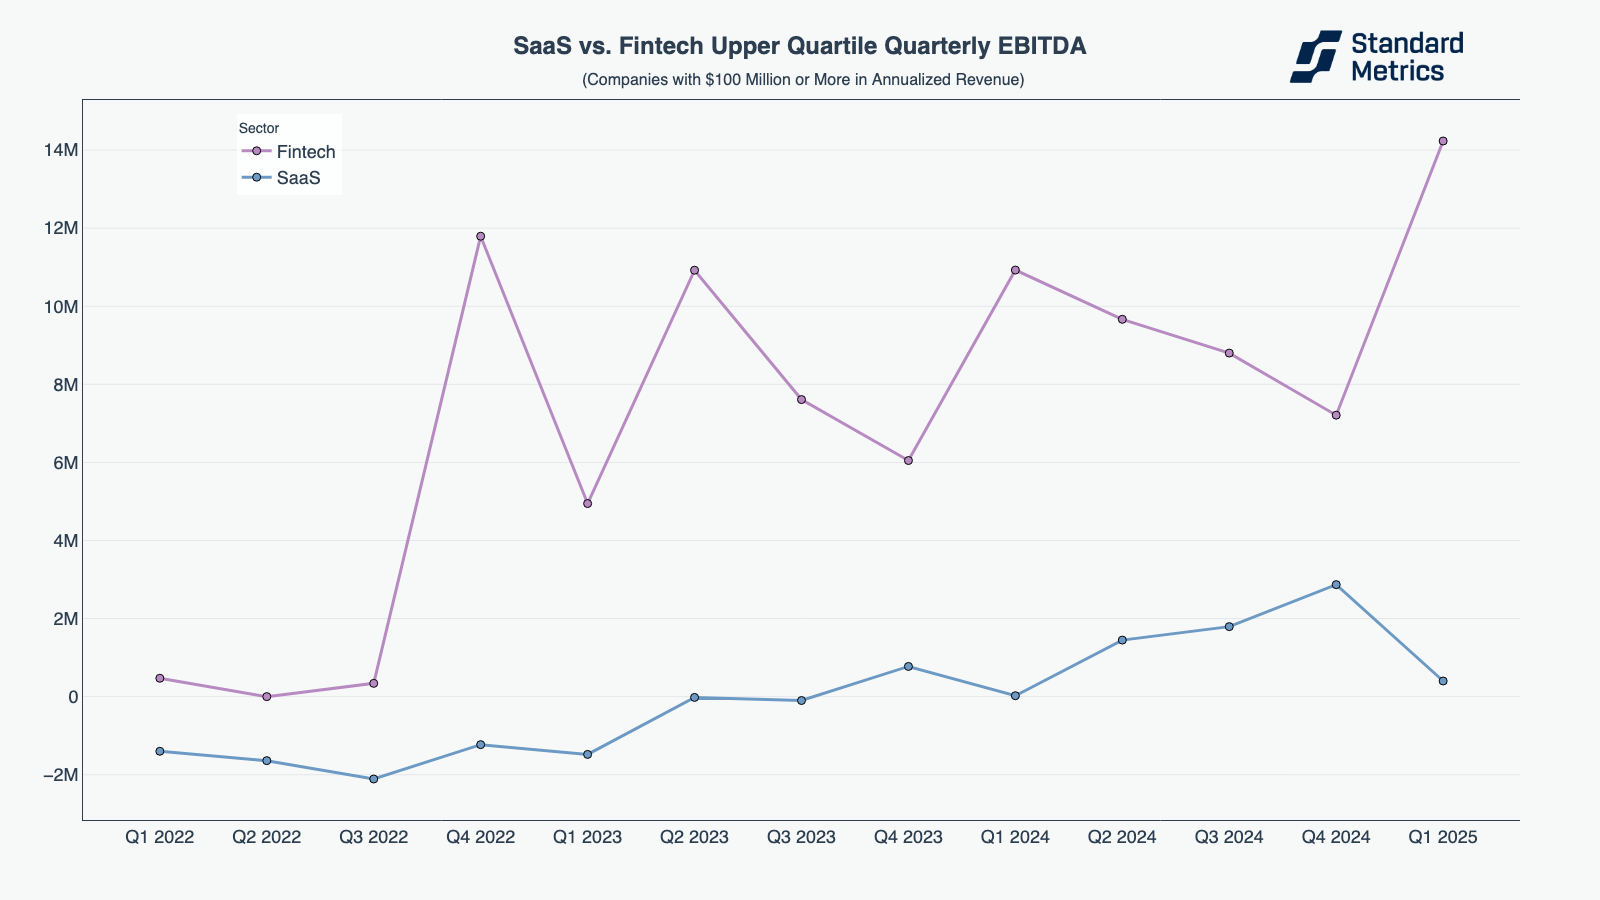
N=49
Standard Metrics’ data aligns with many sources spelling out trouble for traditional SaaS. Jamin Ball, a partner at Altimeter and the author of the popular Substack Clouded Judgment reported a 30% decline YoY in Q1 2025 in aggregate net new ARR in cloud software, for example. Factors driving this performance likely include market saturation, economic uncertainty, and budget shifts towards AI.
Standard Metrics data also corresponds to positive industry chatter that fintech is back. While fintech faces the same problems of market saturation and economic uncertainty as SaaS, many fintech companies seem to be using AI to their benefit — integrating it into their products — rather than letting AI competitors steal their consumers’ dollars. A prime example of this trend? Mobile banking app Chime saw shares increase as much as 59% above their initial offering price in their IPO last week.
Checking in: how IPO-readiness looks in the first quarter
In our report last quarter, our narrative focused on how mid-stage and late-stage startups seemed to be gearing up for IPOs or M&As by focusing on EBITDA multiples, growing revenue, and reducing burn. This quarter, we’ve seen startups hold on to these gains, though continued momentum has slowed amid a tough first quarter.
After a significant reduction in median quarterly net burn across companies of different sizes in Q4 2024, performance decreased slightly in Q1 2025, with companies across revenue ranges burning more than the quarter prior.(2) However, all revenue band cohorts maintained an improved performance compared to Q3 2024.
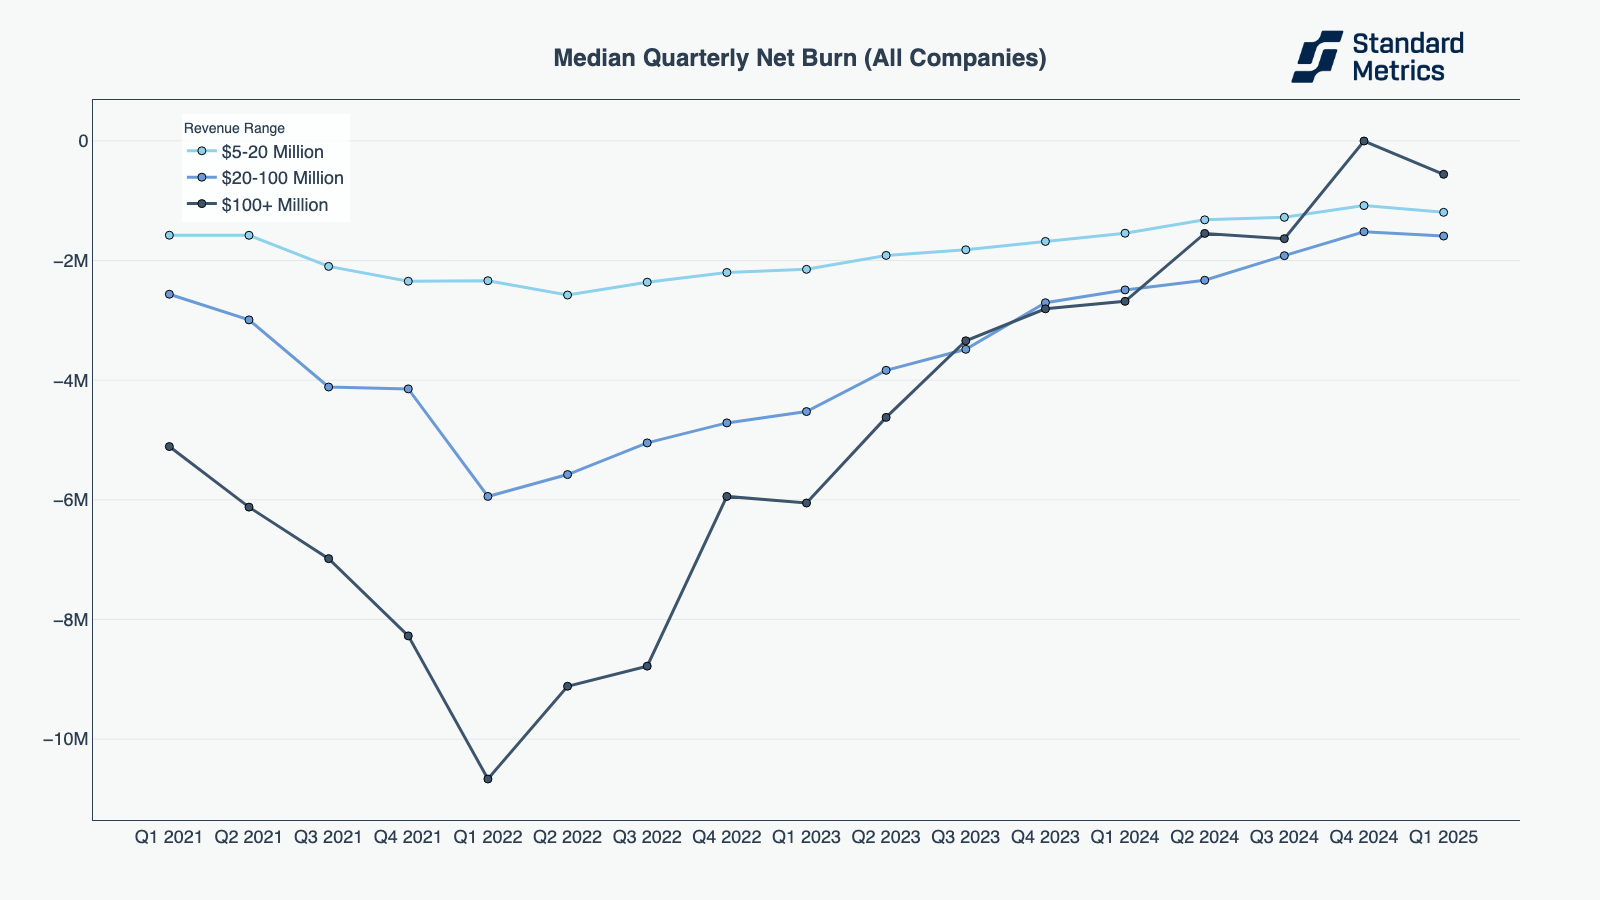
N=322
These same startups fared better in EBITDA this quarter. Companies with $5 to $20 million in annualized revenue saw a slight uptick in the metric, while companies in range of $20 to $100 million in annualized revenue saw a slight downtick. Companies with $100 million or more saw a steeper decline in EBITDA, but the decline comes after a huge performance boost in the metric in Q4 2024.
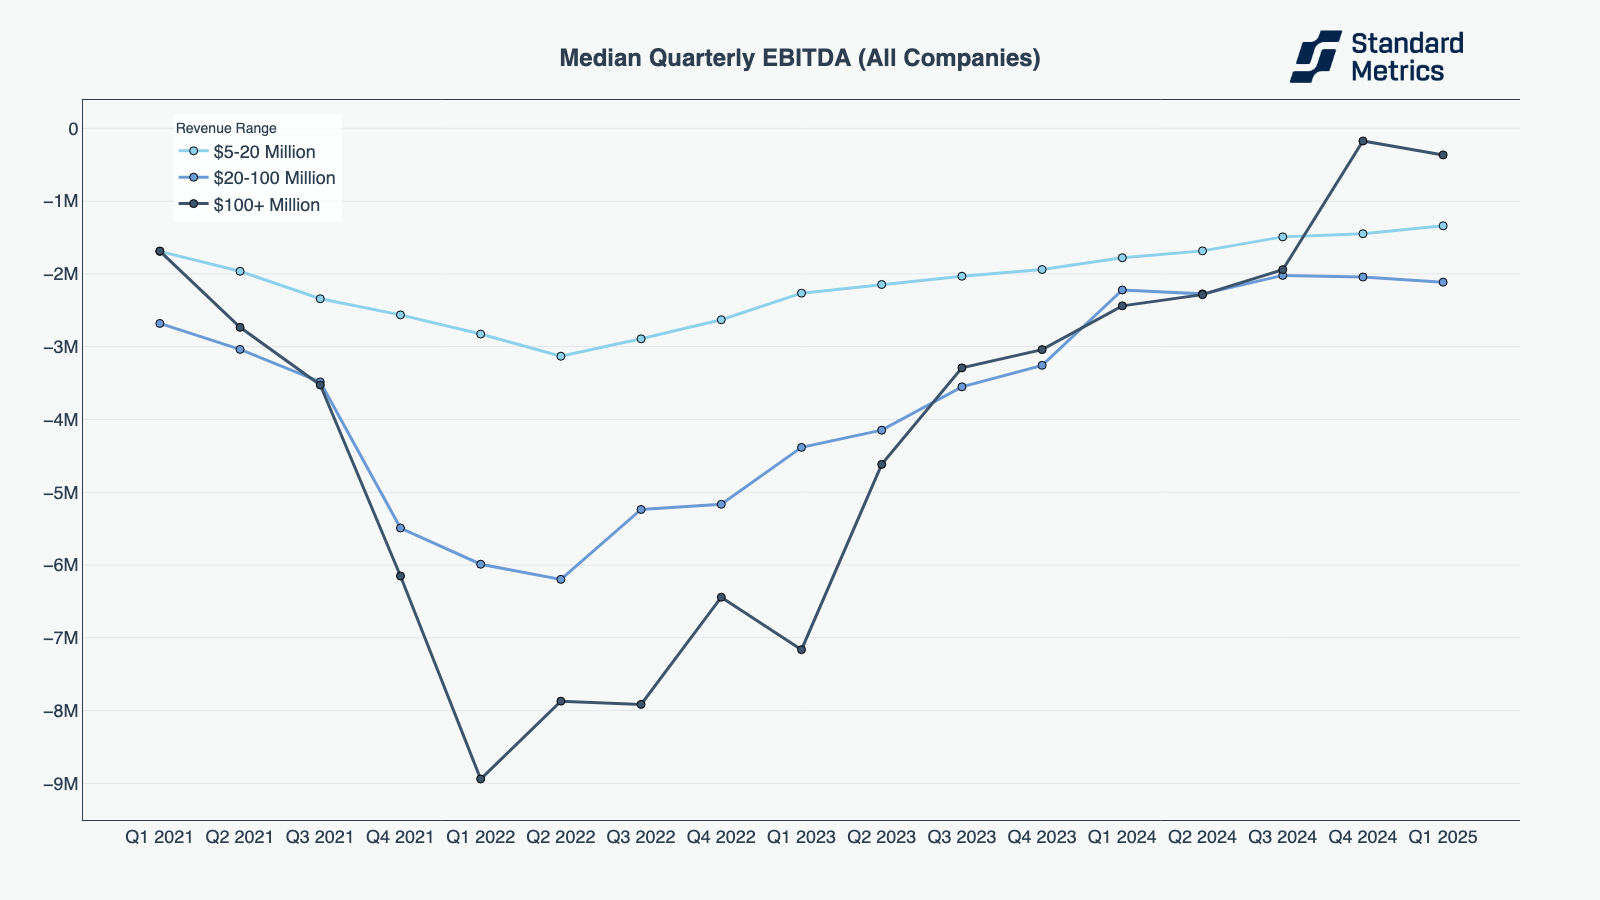
N=247
Last quarter we also saw improvement in workforce productivity, highlighting companies’ abilities to do more with less in tightened economic conditions. Amid Q1 2025 struggles, this efficiency declined slightly.
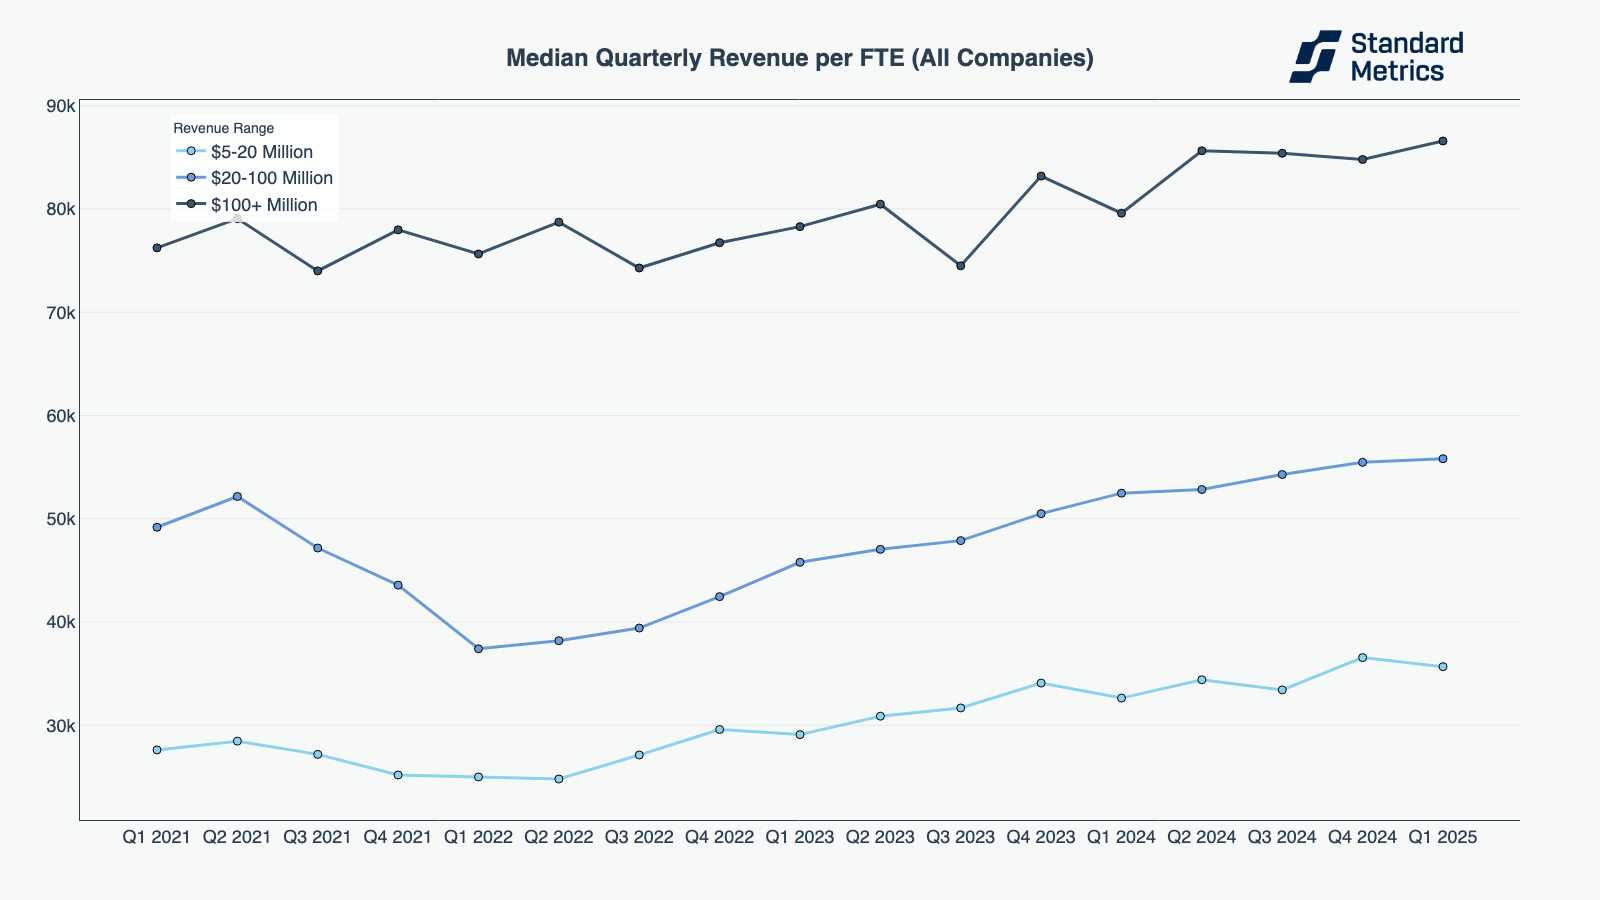
Startups with more than $100 million in annual revenue declined in quarterly net burn per FTE (Full-Time Employee), though continued to improve in median revenue per FTE in Q1 2025. Midsize startups struggled a bit more — with middling or declining performance in both metrics in Q1 2025.
But — as we saw in burn and EBITDA — startups as a whole were still much better positioned for IPO than they were just a year prior.
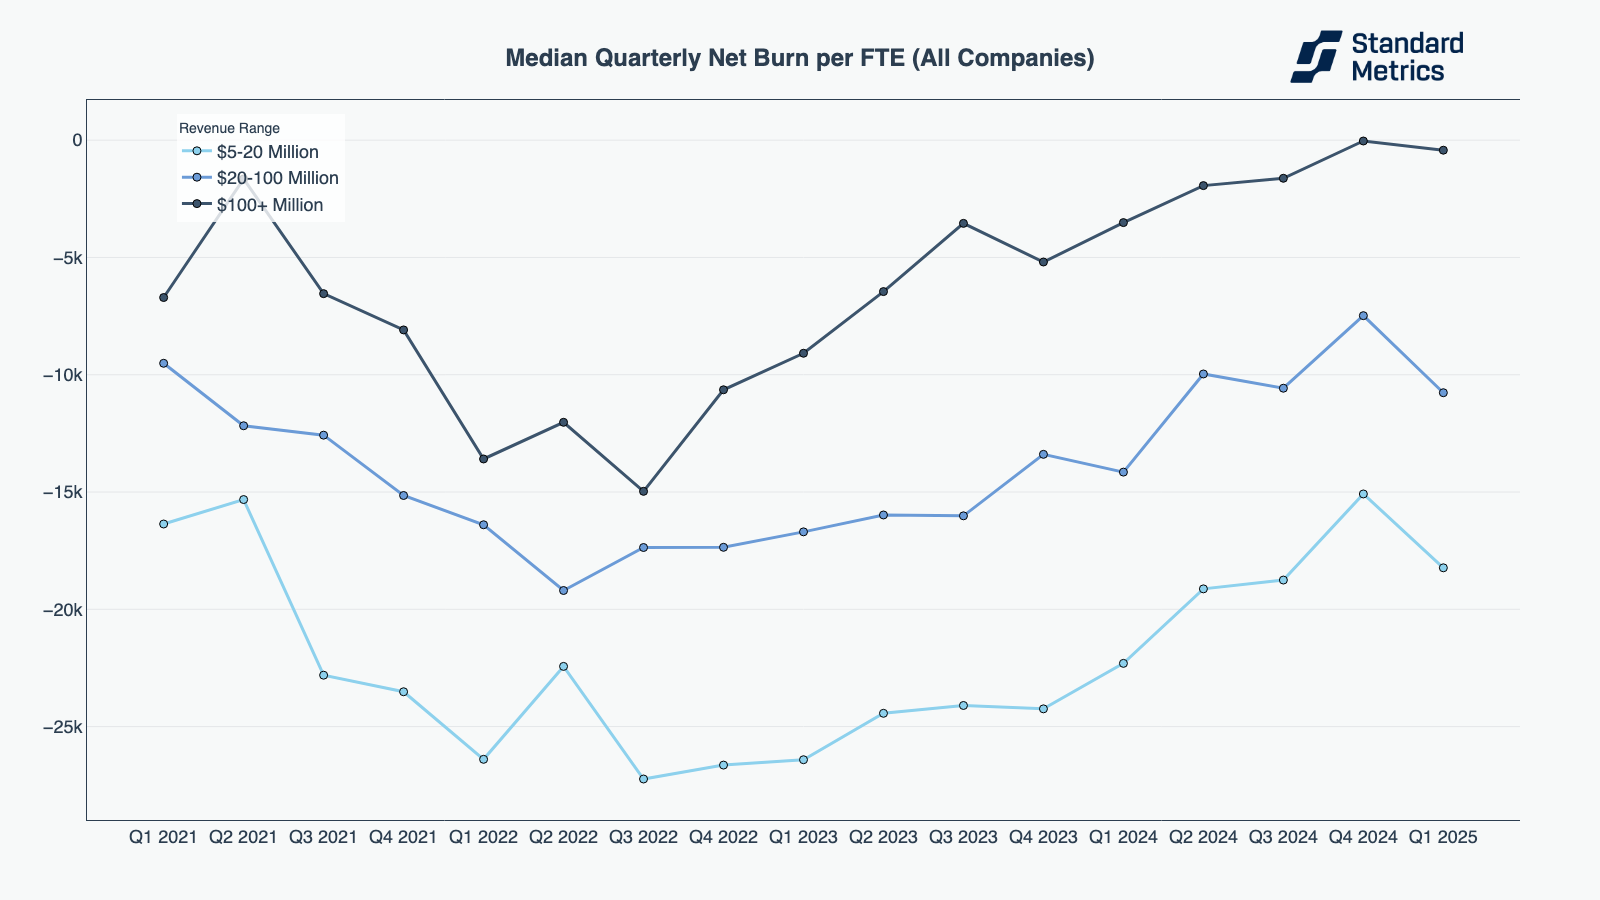
N=266
N=277
The relatively consistent performance in a tough quarter shows that mid and late stage private startups are still attempting to project an image of public-market-readiness. However, while companies have continued to make a strong case for IPOs or acquisitions this quarter, they may hold off on going public amid macroeconomic concerns like tariffs.
Want to dive deeper?
We had a blast diving into how — and why — Q1 can be difficult for startups, how SaaS and fintech are faring in 2025, and how mid- and late-stage companies are continuing to show strength for IPOs and M&As. But our Global Benchmarking product can do so much more, helping you compare your portfolio against 9,000+ startups, segmented by revenue, size, and sector. Have questions? Reach out via the form below.
Thanks for reading, and please reach out if there are any particular topics you’d like for us to cover in the future!
Methodology
This report summarizes data from over 9,000 anonymized startups who report data to their investors on Standard Metrics. Companies are included in an annualized revenue bucket based on their annualized revenue value calculated in each respective quarterly period. Companies self-identify their sector at time of onboarding onto our platform and can update their sector at any time afterwards. Companies are in control of their data on Standard Metrics and can opt out of their data being included in anonymous benchmarking anytime.
For graphs that represent multiple revenue buckets of companies [e.g. “Median Net Burn (All Companies)” chart above], our N count is the minimum number of companies across the smallest cohort in the most recent period (e.g. “Q4 2024”). For graphs analyzing a single revenue bucket on one metric (e.g. “Revenue Growth Trends Across Late Stage Startups” chart above), N is the number of companies in the most recent period in the chart. Data points must have at least 30 companies to be shown.
Footnotes
(1) Benchmarking data is inherently subject to cohort effects, particularly when comparing different time periods. Shifts in the composition of participating companies—such as the onboarding of higher-performing firms or changes in sector representation—may influence aggregate trends. While these benchmarks offer valuable directional insights, they should be interpreted with the understanding that cohort dynamics can impact quarter-over-quarter comparisons.
(2) Net Burn is equal to Cash Flow from Operating Activities on the Cash Flow Statement. Decreases in Cash are marked as negative values.
Automate your portfolio reporting
Find out how you can:
- Collect a higher volume of accurate data
- Analyze a robust, auditable data set
- Deliver insights that drive fund performance