
Standard Metrics’ portfolio monitoring platform serves a wide variety of VC and PE firms, some investing in a single stage or sector and others investing across multiple sectors and sizes. All portfolio companies aren’t created equal: information that might be critical to know about one may be irrelevant or misleading for another.
While a firm could put in a blanket request across all the companies in their portfolio for the same set of metrics, we’ve seen a more nuanced data collection strategy (that takes these differences into account) prove more effective. It’s less of a burden on a firm’s portfolio companies, so it creates a higher likelihood of comprehensive and accurate responses.
Given this, the first question that many of our customers often ask us is what other investors request from portfolio companies at different stages and in different industries. We put together this guide as a starting point.
How requests vary by stage
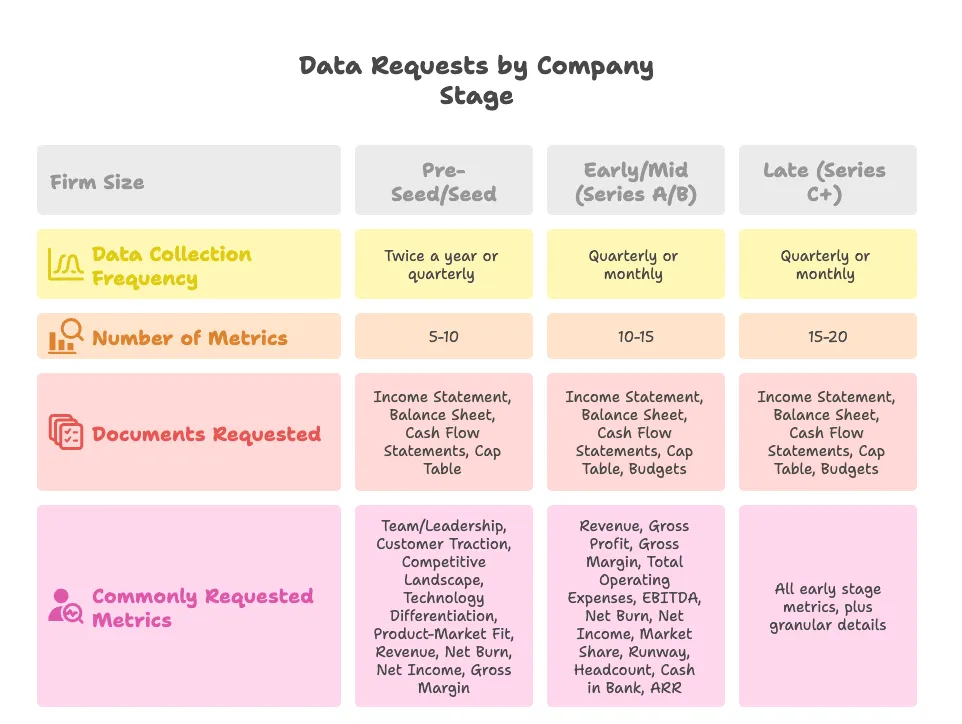
One common strategy our firms use for data collection is segmenting their asks by company stage or size. All seed stage companies get the same list of questions, for example, while late stage companies get a very different list.
Pre seed and seed companies
Pre-seed or seed stage companies are companies that often have less institutional structure around their financial performance metrics. They may not have a CFO or any one person at the company focused on financial data, they may not have a robust process for collecting or managing their data, and they may have just one or two investors.
A general rule of thumb we see our customers follow here is asking for less data from these sorts of portfolio companies, as well as asking for more qualitative metrics than quantitative ones.
For companies at this stage, Standard Metrics is helpful for building an investor relations process, offering easy-to-use investor update functionality where portcos can ask for help or for intros to other investors.
- Data collection frequency: Twice a year or quarterly
- Number of metrics: 5-10 (often a mix of qualitative and quantitive requests, with less requests if the company is pre-revenue)
- Documents requested (when relevant): Income Statement (P&L), Balance Sheet, Cash Flow Statements, Cap Table
- Qualitative asks: Team and Leadership, Customer Traction, Competitive Landscape, Technology Differentiation, Product-Market Fit,
- Commonly requested metrics: Revenue, Net Burn, Net Income, Cash in Bank, Runway, and Gross Margin
Early and mid stage companies: Series A and Series B
Early and mid stage companies often have a much more mature financial reporting process than seed stage companies, often reporting to multiple investors with a wider variety of quantitive information.
Standard Metrics can serve as a reporting hub for these companies, where many quarters of performance data is centralized in one place, financial information is easily uploaded via form fills and accounting integrations (versus sent over and over again in different emails to different investors), and performance benchmarking to other companies in their sectors and size is free and easy to use.
We also see many companies at this stage start to report to multiple investors on our platform.
- Data collection frequency: Quarterly or monthly
- Number of metrics: 10-15
- Documents requested: Income Statement (P&L), Balance Sheet, Cash Flow Statements, Cap Table, Budgets
- Commonly requested metrics include: Revenue, Gross Profit, Gross Margin, Total operating expenses, EBITDA, Net Burn, Net Income, Runway, Headcount, Cash in Bank, ARR
Late stage companies: Series C+
Like early and mid-stage companies, late stage companies generally have a mature financial reporting process with multiple investors requiring a wide variety of qualitative and quantitive data.
Because of this, we largely see firms adopt a similar strategy for late stage companies on Standard Metrics as they do for their early and mid-stage portfolio companies (with slightly more granularity and quantity in their data asks).
- Data collection frequency: Quarterly or Monthly
- Number of metrics: 15-20
- Documents requested: Income Statement (P&L), Balance Sheet, Cash Flow Statements, Cap Table, Budgets, 409A
- Commonly requested metrics include: All the metrics of early stage companies as well as more granular information about previously requested metrics (e.g. operating expenses broken into R&D Spend, S&M Spend, and G&A Spend), debts, more industry specific questions, and forecasted metrics
Other common variations to requests
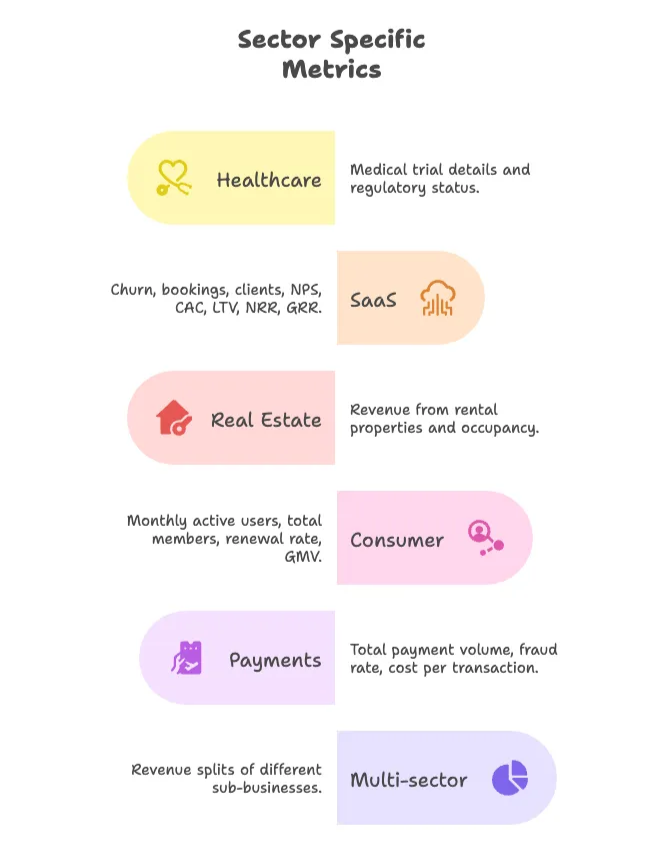
Beyond changes to requests by company stage, our customers often vary requests for companies in different sectors. Common sector-specific metrics include:
- Healthcare: Medical Trial Details (Milestones), Regulatory Status (FDA/EMA), States Active, People Directly Served
- SaaS: Churn, New Bookings, Number of Clients, NPS, CAC, LTV, NRR, GRR
- Real Estate: Number Of or Revenue From Rental Properties, Occupancy,
- Consumer / Member Based: Monthly Active Users, Total Members, Renewal Rate, Gross Merchandise Value
- Payments: TPV, Fraud or Default Rate, Cost Per Transaction
- Multi-sector businesses: Revenue splits of different sub-businesses
Geography also influences requests. Certain metrics are legislatively mandated in reporting, which varies by country. Many firms with global portfolio companies request metrics like revenue splits by countries or regions.
How can Standard Metrics help?
We firmly believe that a nuanced data collection strategy taking company differences like sector or geography into consideration can improve the reporting process, save you and your portfolio companies time, and lead to better and more comprehensive data. On top of the variations on requests to different groups of companies outlined above, Standard Metrics also allows for customers to request custom metrics for each individual company in a firm’s portfolio as well for maximum customizability.
Have further questions? If you’re a current Standard Metrics customer, we’d love to help: reach out to your CSM who can provide further guidance. If you’re not yet a Standard Metrics customer, we’d be happy to give you more information about how the platform can help you segment your reporting process by size, sector, or geography. Get in touch!
Automate your portfolio reporting
Find out how you can:
- Collect a higher volume of accurate data
- Analyze a robust, auditable data set
- Deliver insights that drive fund performance