

The last few years have been a whirlwind for venture-backed startups. In 2021, the market was awash with capital, fueling unchecked spending, sky-high valuations, and aggressive expansion. Growth-at-all-costs was the mantra. But in 2022, the music stopped. Market conditions shifted amid inflation, rising interest rates, and recession fears; capital dried up, and startups found themselves in survival mode.
Now, the latest Global Benchmarking data from Standard Metrics—the portfolio data management platform for over 100 VC firms and 8,000 startups—reveals a fundamental transformation for late-stage startups leading up to Q4 2024.1 Late-stage startups ($100M+ annualized revenue) aren’t just waiting for private capital to return to previous levels—they’re taking matters into their own hands, recalibrating their strategies, and reshaping their financial plans for a new market reality.
While some reports highlight a handful of companies readying to IPO in 2025, our data tells a broader story: Late-stage startups across the board are getting financially fit for what’s next. But amid a volatile market, what are companies’ next moves? Are late-stage companies gearing up for IPOs in a volatile equity market? Preparing for long-awaited M&A after years of high private valuations and regulation constraints? Or is this just the inevitable shakeout, in which only the strongest businesses emerge with sustainable financials?
Regardless, across key financial metrics—net burn, EBITDA, revenue, headcount, operating expenses, gross margin, and more—the shift in financial strategy is unmistakable.
The era of efficiency
Over the last three years, late-stage startups have undergone a dramatic financial transformation toward efficiency. Net burn, EBITDA, net burn per FTE, and revenue per FTE provide the clearest early signals of this shift.
From spending sprees to sustainable burn
In 2021, companies were burning through cash at unprecedented rates, fueled by an explosion in venture capital investment. Global venture funding more-than-doubled year-over-year, growing 111% from 2020 levels as investors poured money into unicorns and high-growth startups. As funding flooded the market, valuations soared, and startups scaled aggressively—often without the unit economics to justify their burn rates.
At the peak of this era in Q1 2022, the median late-stage company burned $10.6M per quarter. Growth-at-all-costs was the dominant strategy, but the math wasn’t penciling out. Many startups were spending far more than they could sustainably generate in revenue, propped up by the expectation of continued investor support rather than underlying business fundamentals.
But the tide turned in 2022 and 2023 amid surging interest rates, a volatile stock market, and recession fears. According to Crunchbase data and a CB Insights report, global venture funding declined 35% year over year in 2022. Investors kept more cash on the sidelines, forcing startups to shift from hyper-growth to survival mode.
Companies made serious adjustments to this scarcity of cash. By Q4 2024, median quarterly net burn2 was scratching at cash-flow-positive levels for late-stage companies—less than three years after the immense spend seen in Q1 2022.
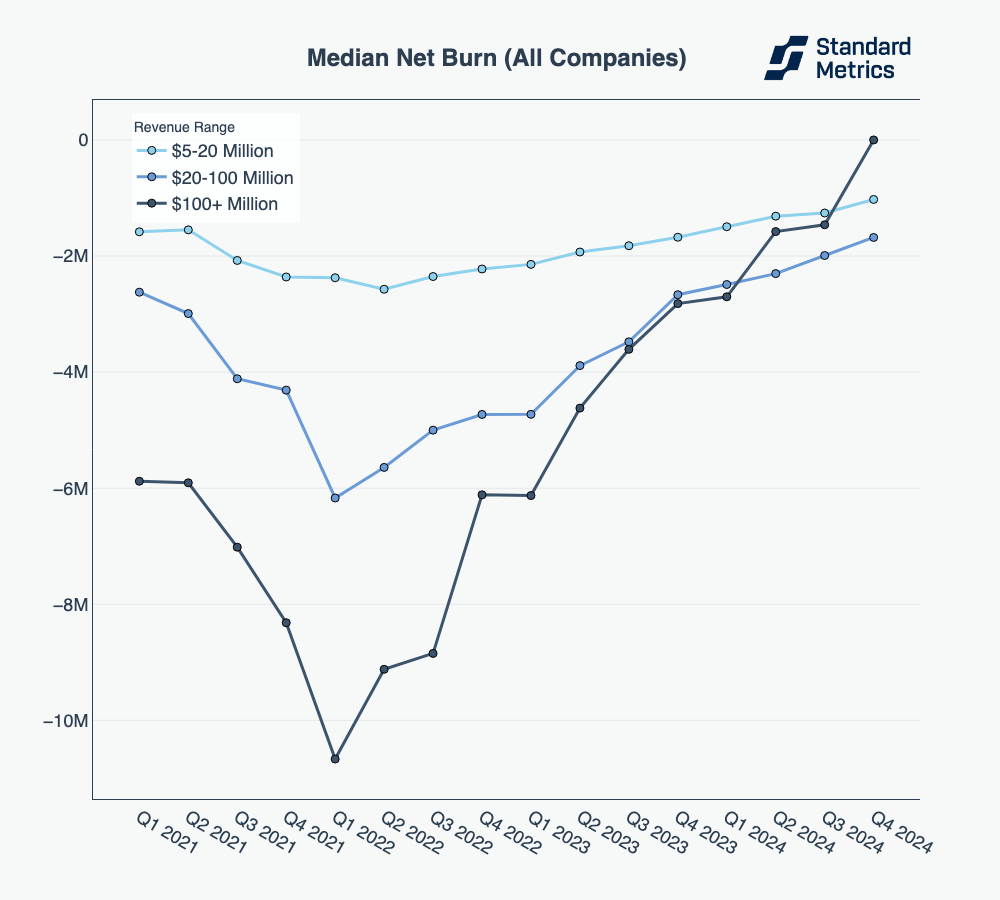
Late-stage companies burned cash at record rates in Q1 2022 (median burn was $10.6M in that quarter), but then improved net burn (burned less) from early 2022 onwards.
N = 293
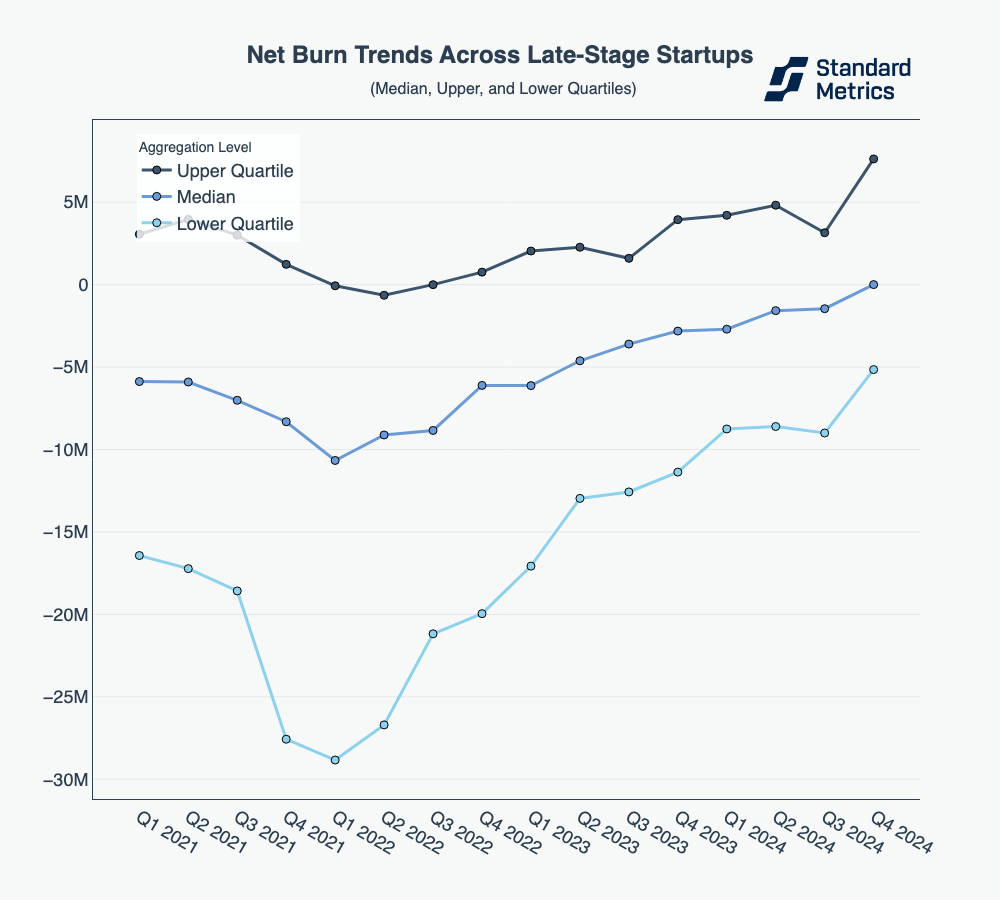
Net burn is improving across the board for late-stage companies. Even the highest-burn late-stage companies have significantly tightened controls, with companies in the 25th percentile bucket of net burn improving by 82% from Q1 2022 to Q4 2024.
N = 293
What about earnings?
We see this shift reflected in EBITDA (Earnings Before Interest, Taxes, Depreciation, and Amortization) as well. In 2021, EBITDA fluctuated significantly—and late-stage startups hit rock bottom levels in the first quarter of 2022.
Since then, eyes have clearly been trained on improving earnings: EBITDA has made a strong move toward positivity, a demand made by late-stage investors who value companies through the lens of the EBITDA multiple. In Q4 2024, median quarterly EBITDA for late-stage companies nearly broke even at -$338K, marking a 96% improvement from its Q1 2022 low of -$8.94M. Meanwhile, upper-quartile quarterly EBITDA for late-stage companies in Q4 2024 soared to a positive $6.33M—the highest level recorded in recent years.
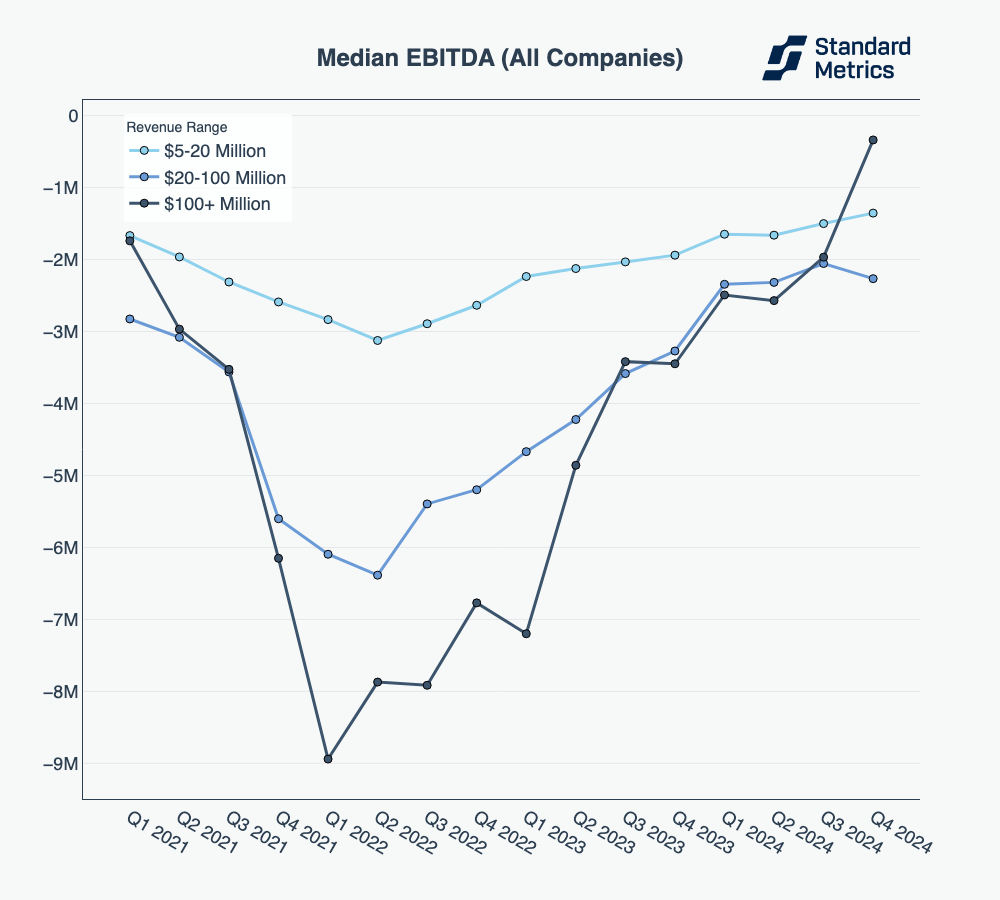
A negative EBITDA indicates that a company’s core operations are not generating enough profit to cover operating expenses, suggesting potential financial instability and unprofitability. Median quarterly EBITDA for late-stage companies hit a low of -$8.94M in Q1 2022 before rebounding to -$338K in Q4 2024.
N = 197
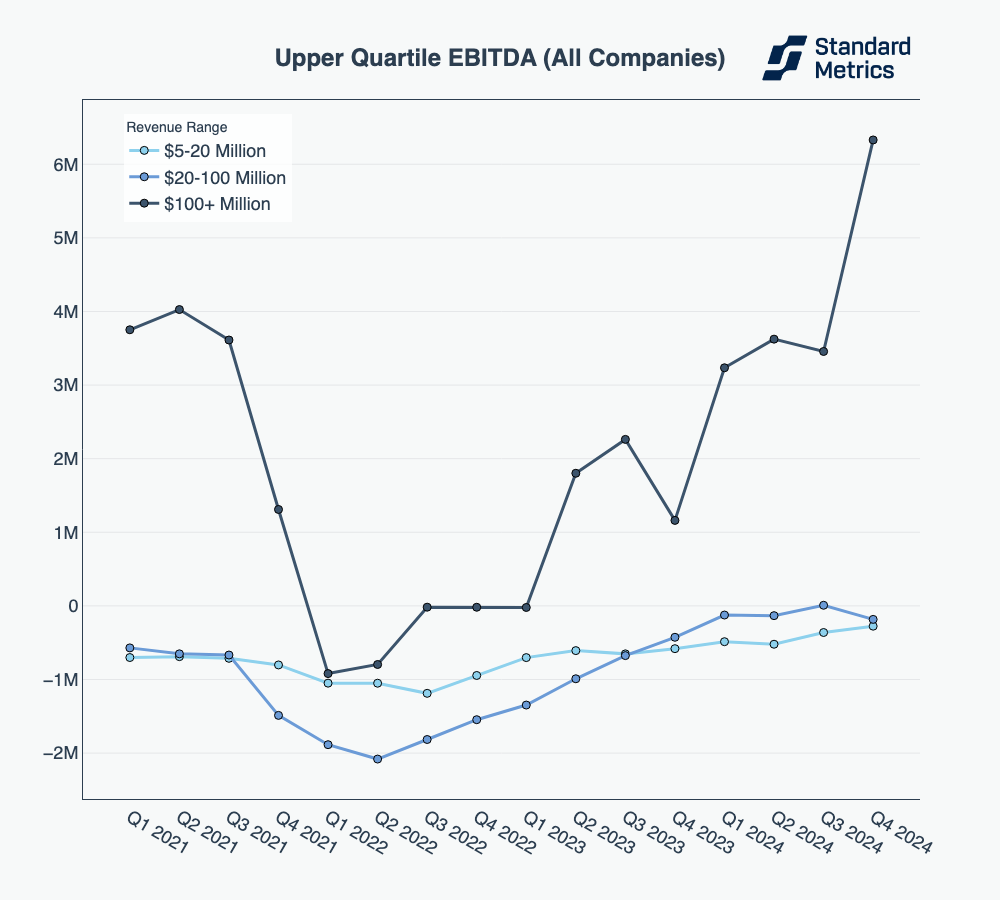
Upper-quartile EBITDA for late-stage companies reached its lowest point (-$920K) in Q1 2022 before surging to $6.33M in Q4 2024—the highest level recorded in recent years.
N = 197
The story of unit economics
In tandem with burn and EBITDA, another striking mark of this era of efficiency is the dramatic improvement in workforce productivity. As capital constraints tightened in 2022, companies were forced to do more with less. Quarterly net burn per FTE (Full-Time Employee) has steadily improved, a clear indication that startups are prioritizing lean, cost-effective operations. Teams are smaller but more productive, shedding non-mission-critical costs that were masked by the easy-money era.
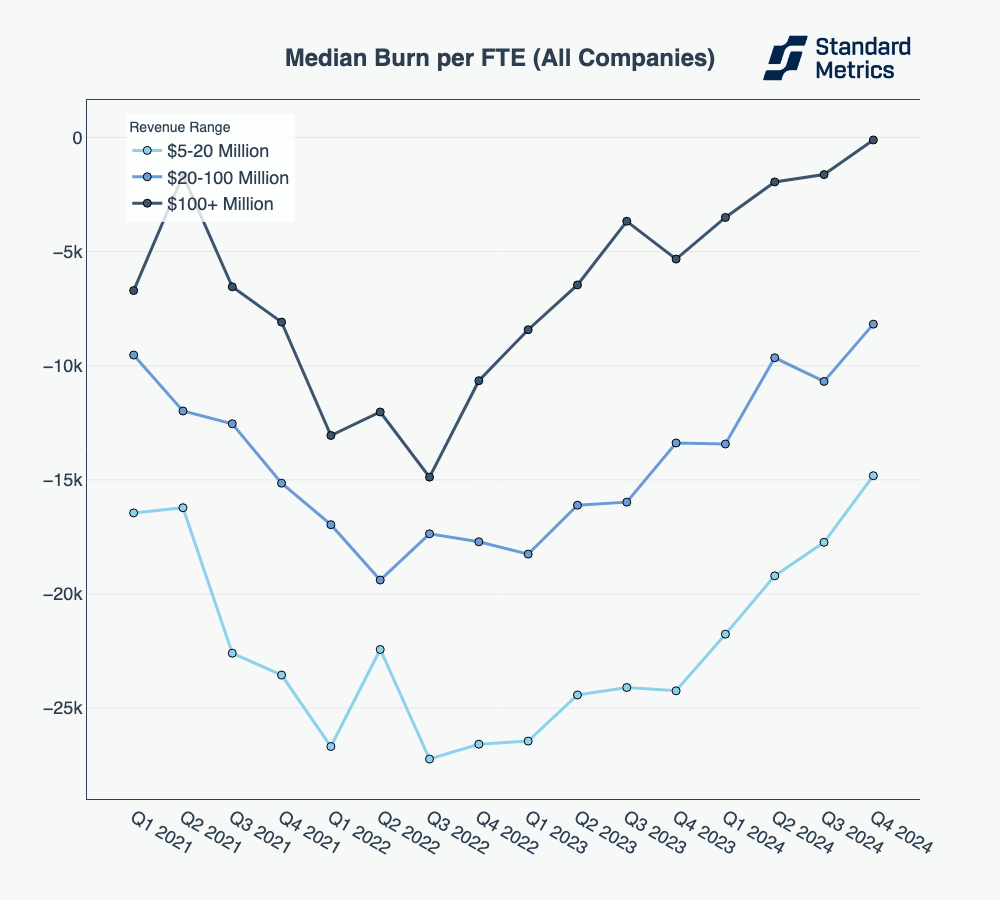
Burn per FTE – measuring the net burn a company incurs for each full-time employee – has been improving across the private markets as companies have become more efficient.
N = 242
At the same time, quarterly revenue per FTE – albeit in a more modest fashion – has risen, reinforcing that this movement is about building stronger, more financially disciplined businesses. Median companies across revenue scales are demonstrating greater top-line output per employee, a testament to the operational rigor that has emerged in this new funding environment.
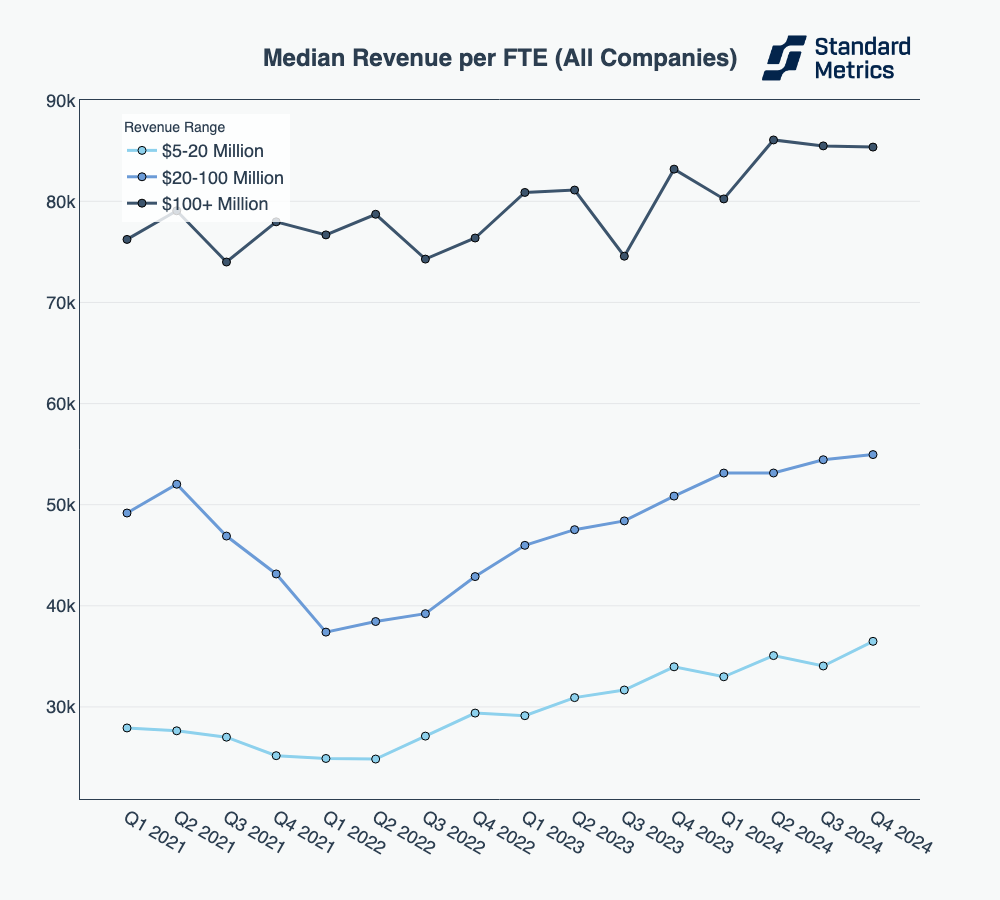
Revenue per FTE – measuring how much revenue a full time employee (or the equivalent) generates for a company – is improving across private companies indicating that companies are getting more output per employee.
N = 255
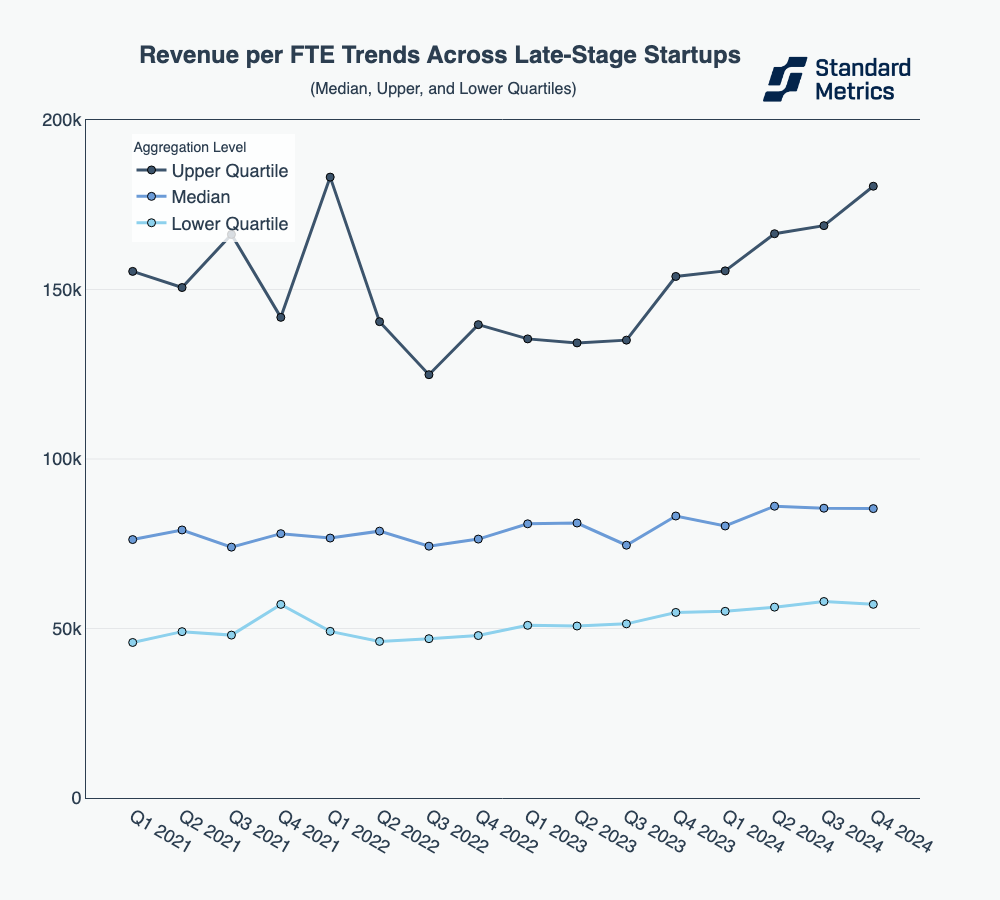
The top quartile late-stage startups are the ones with the most pronounced gains in revenue per FTE over the past year.
N = 255
What’s driving the efficiency?
The past couple of quarters have ushered in a new era of efficiency—lower burn, stronger earnings, and improved unit economics. This sparks the question: Where is this efficiency coming from? Are late-stage startups with 100M+ in annualized revenue accelerating growth, or are they simply cutting costs?
The speed of revenue growth
When studying the Global Benchmarking data across late-stage startups, we see that quarterly revenue growth declined from 2021 to 2022 then remained relatively flat from 2022 to 2024. While Q4 2024 showed a notable uptick in revenue growth, particularly in the upper quartile, this recent boost in isolation likely isn’t enough to explain the stronger earnings and improved burn metrics we’re seeing today. Instead, the broader trend of flattened revenue growth suggests that companies have been investing less aggressively in expansion, which, in turn, has reduced their near-term capital requirements. With fewer resources allocated to scaling rapidly, costs have come down, leading to the improved burn efficiency and stronger EBITDA performance that has signaled this era of efficiency.
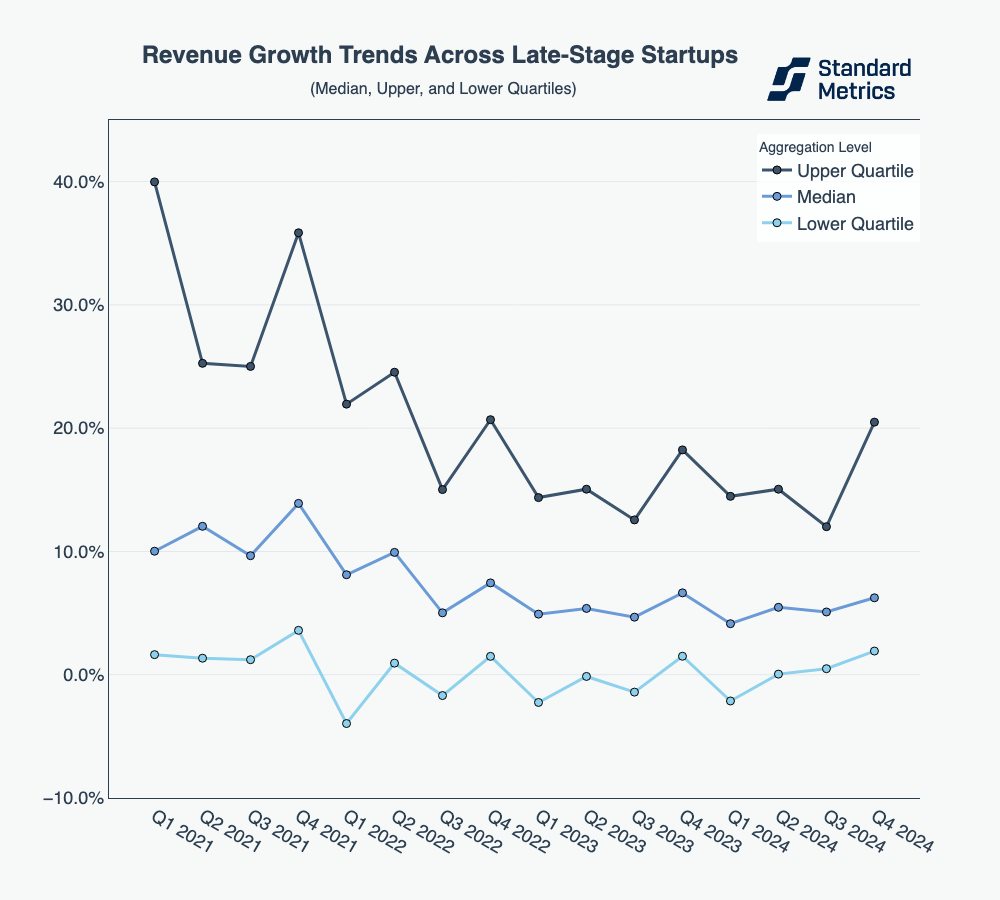
Revenue growth for late-stage companies dropped following 2021 and has remained relatively flat since. A positive bump in Q4 2024 indicates companies are potentially revitalizing growth.
N = 316
How about hiring?
Since revenue growth doesn’t appear to have been the sole driver of earnings and economic growth, a closer look at operational discipline and cost control is essential. During the venture capital boom of 2021 and early 2022, companies continued to expand their teams aggressively. However, hiring momentum slowed in late 2022, and by 2023, and companies began actively reducing workforce size.
Unlike previous downturns, where layoffs were reactive cost-cutting measures, the steady decline in headcount over multiple quarters signals a more deliberate, structural shift in hiring strategies. Companies are prioritizing leaner teams, greater productivity, and long-term sustainability over sheer growth. This shift has played a key role in strengthening financial resilience.
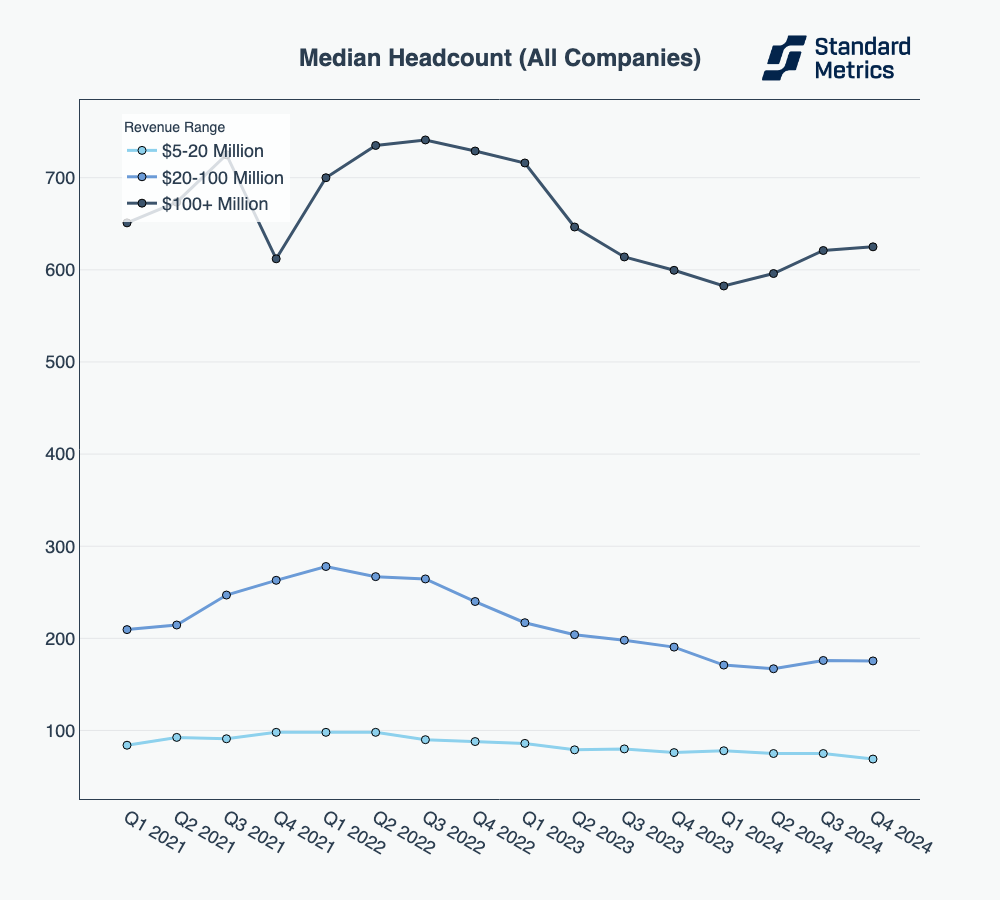
Median headcount for late-stage companies peaked at 741 employees in Q3 2022, before declining as late-stage startups prioritized efficiency and leaner teams.
N = 203
How is this reflected in operating expenses?
As one would expect, the steady decrease in headcount has also been reflected in operating expenses. While no dramatic shift has occurred, late-stage startups in the upper quartile have clearly focused on continual diligence around operational costs.
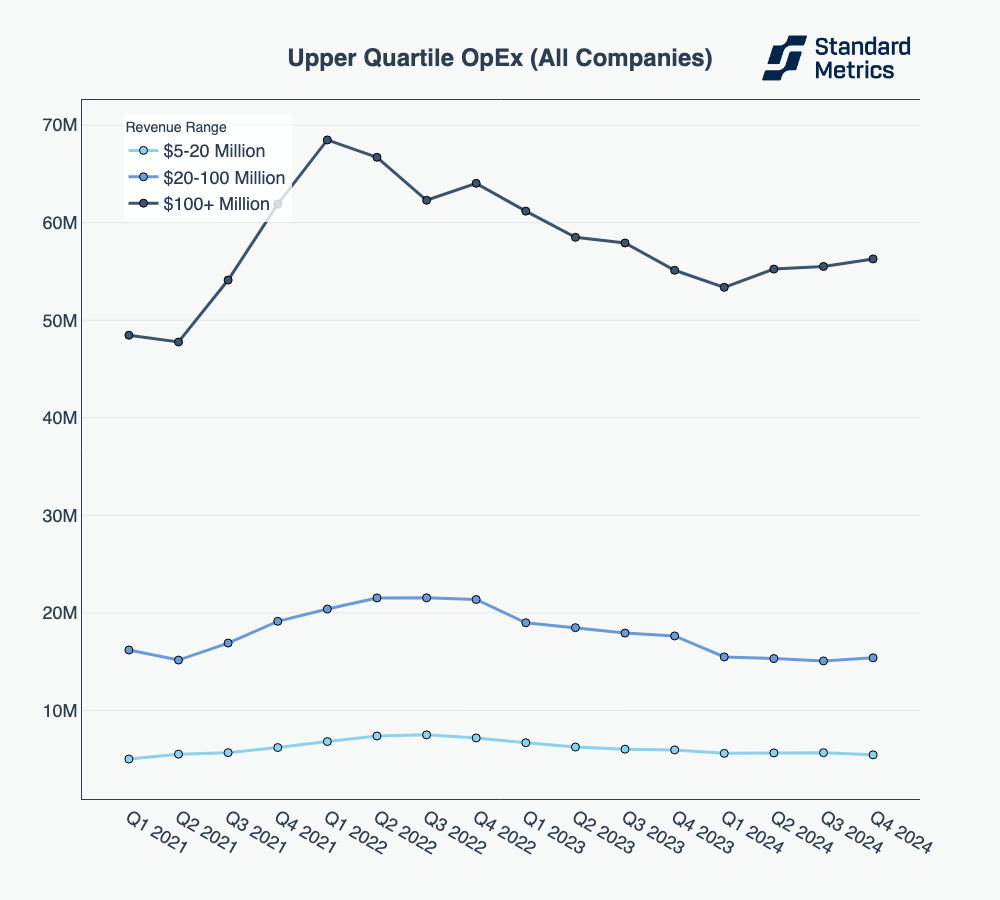
Upper-quartile operating expenses for late-stage companies peaked at $68.5M in Q1 2022 before gradually declining to $56.3M by Q4 2024, reflecting a shift to more disciplined financial management.
N = 261
A growing gross margin
With headcount mildly tightening and operating expenses gradually declining, the sharp gains in efficiency remain slightly unclear — until we look at gross margin. Late-stage startups, in particular, have made gross margin a key focus, improving the metric by over ten percentage points since the end of 2021. Better pricing power, higher-margin revenue streams, and AI automation (e.g. in support functions) are a few factors that could be at play in this efficiency unlock.
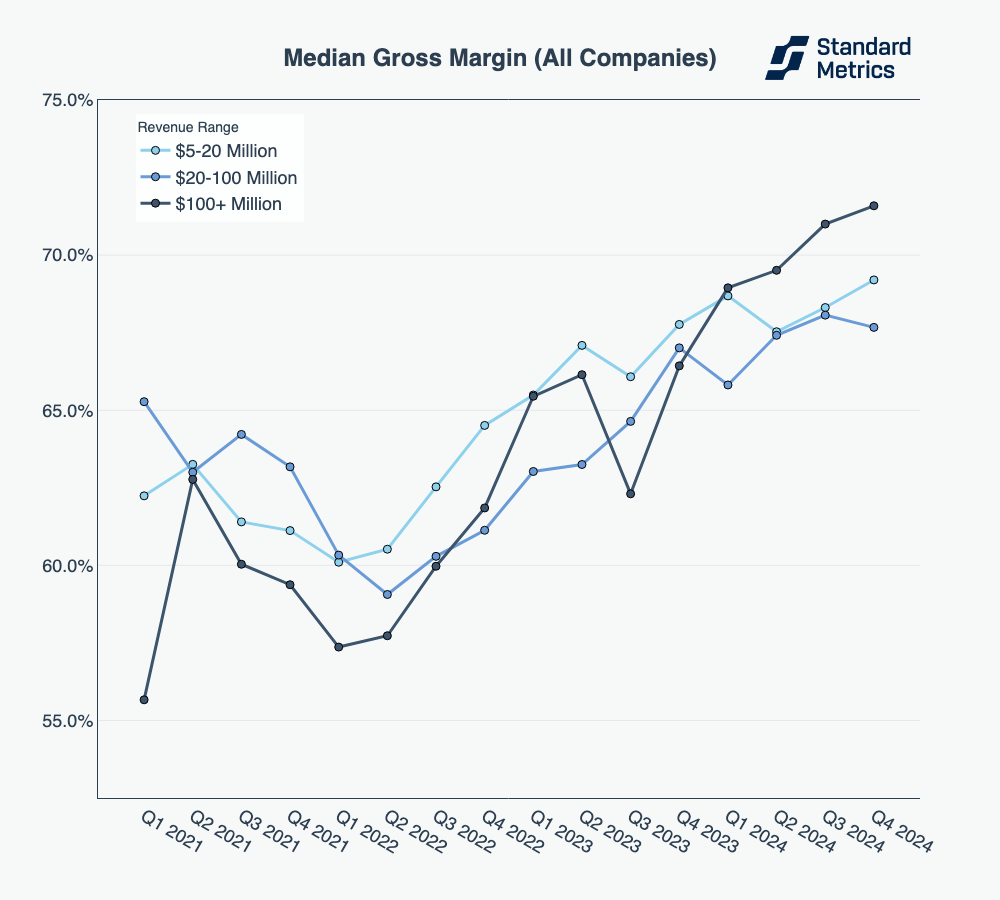
Gross margin – the percentage of revenue that remains after deducting cost of goods sold (COGS) – has improved dramatically across revenue buckets.
N = 259
The “get-real” moment: What comes next?
The narrative that emerges from these numbers is powerful. Over the past four years, late-stage startups have undergone a dramatic three-phase transformation:
- 2021 (“The party”): Venture-backed startups raised record amounts of capital and spent aggressively to drive growth and win their markets at all costs.
- 2022-2023 (“The wake-up call”): Market conditions shifted, capital dried up, and companies had to get serious about spending, earnings, and economics.
- 2024 (“The ‘get-real’ year”): Late-stage startups are now fully embracing a push toward profitability, making them prime candidates for IPOs or strategic acquisitions.
This shift isn’t just theoretical—it’s happening in real time, and it has massive implications for investors, founders, and broader market participants. The data indicates that a significant number of late-stage startups are preparing for public and acquisitive scrutiny. Across the median and upper quartile, companies are taking deliberate steps to tighten operations, improve margins, and pay attention to the market’s request for profitability. But it raises the obvious next question: Where do these companies go from here?
The question is not if these companies will seek exit events, but how—and whether market conditions will accommodate them:
- All eyes on the IPO window. The fastest-growing category leaders are getting IPO-fit, watching the market closely for the right timing. Public market volatility, geopolitical instability, and trade tensions have injected fresh uncertainty into investor sentiment. At the same time, a pro-growth, deregulation-focused administration could create favorable conditions for companies considering an IPO.
- M&A momentum is building. After years of holding onto 2021 valuations, many companies who aren’t growing fast enough are finally adjusting expectations and considering acquisition opportunities. With a new administration, regulatory hurdles for M&A could be diminished.
- Some will choose to stay private and independent. With cost structures now aligned for long-term sustainability, late-stage startups can have a level of strategic flexibility they lacked in the past. Staying private and independent may be a preferred option.
The market is turbulent, but the data is undeniable: Late-stage private companies are building businesses in a new era of efficiency. The calls for fitness in the public markets are finally seeping into the private markets. The IPO and M&A windows may not be wide open, but they surely aren’t closed. The strongest companies—those that have successfully transitioned from hemorrhaging cash to profitability—are in a position to take the leap.
Interested in diving deeper? Explore our Global Benchmarking product to compare your portfolio against 8,000+ startups, segmented by revenue scale and sector. Have questions? Reach out via the form below.
Methodology
This report summarizes data from over 8,000 anonymized startups who report data to their investors on Standard Metrics. Companies are included in an annualized revenue bucket based on their annualized revenue value calculated in each respective quarterly period. Companies self-identify their sector at time of onboarding onto our platform and can update their sector at any time afterwards. Companies are in control of their data on Standard Metrics and can opt out of their data being included in anonymous benchmarking anytime.
For graphs that represent multiple revenue buckets of companies [e.g. “Median Net Burn (All Companies)” chart above], our N count is the minimum number of companies across the smallest cohort in the most recent period (e.g. “Q4 2024”). For graphs analyzing a single revenue bucket on one metric (e.g. “Revenue Growth Trends Across Late Stage Startups” chart above), N is the number of companies in the most recent period in the chart. Data points must have at least 30 companies to be shown.
Footnotes
1 Benchmarking data is inherently subject to cohort effects, particularly when comparing different time periods. Shifts in the composition of participating companies—such as the onboarding of higher-performing firms or changes in sector representation—may influence aggregate trends. While these benchmarks offer valuable directional insights, they should be interpreted with the understanding that cohort dynamics can impact quarter-over-quarter comparisons.
2 Net Burn is equal to Cash Flow from Operating Activities on the Cash Flow Statement. Decreases in Cash are marked as negative values.
Automate your portfolio reporting
Find out how you can:
- Collect a higher volume of accurate data
- Analyze a robust, auditable data set
- Deliver insights that drive fund performance